Figure 3.
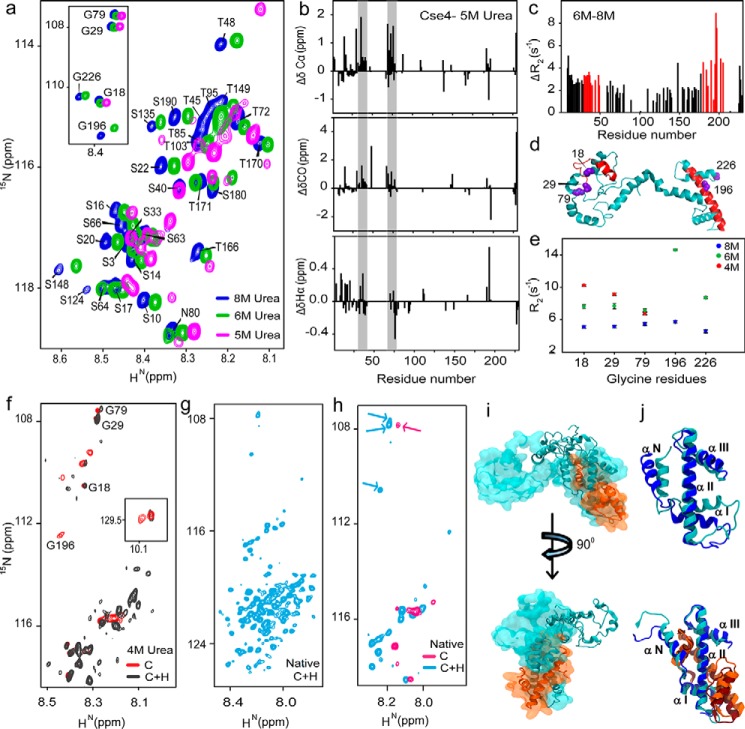
H4 stabilizes CENP-ACse4. a, representative regions of 1H-15N HSQC spectra of Cse4 at different urea concentrations. Inset, peak positions of five Gly residues in similar conditions. b, structural propensities of Cse4 in 5 m urea. Plots of secondary chemical shifts from ΔδCα, ΔδCO, and ΔδHα of residues Asp-15 to Ser-18 (not marked), 30–42, and 75–78 show helical propensity (gray bars). c, difference between the residue-wise R2 rates of Cse4 in 8 and 6 m urea. Residues showing maximum difference for each domain are marked in red. d, modeled Cse4 structure (21) shows the position of residues showing higher R2 difference (red). Note that they are a part of the END and HFD regions. The Gly residues are shown in violet. e, R2 for Gly residues in different denaturant concentrations. f, overlapped regions of 1H-15N HSQC spectra of Cse4 and Cse4–H4 in 4 m urea buffer. Gly residues are marked to show broadening of the C-terminal residues. Inset, Trp side-chain peaks. g, 1H-15N HSQC spectrum of Cse4–H4 complex without denaturant. h, overlap between 1H-15N HSQC spectra of Cse4 and Cse4–H4 in the native state. The arrows indicate reappearance of the NTD Gly residues in the Cse4–H4 spectrum. i, overlap of the structure of Cse4–H4 at the start (space-filled) and end (ribbon) of simulation 1. The N terminus does not fold back on the C terminus. j, arrangement of the C-terminal helices with and without H4 binding at the start (Cse4, blue; H4, orange) and end (Cse4, cyan; H4, brown) of the simulation.

