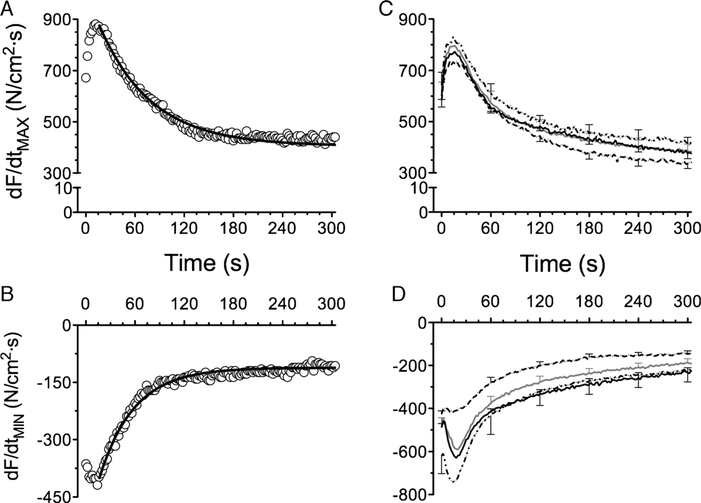
FIGURE 5 —
Rate of contraction (dF/dtMAX) and relaxation (dF/dtMIN) during fatiguing contractions. Representative data from control muscle (open circles) and line of best fit using nonlinear regression (solid line) for dF/dtMAX (A) and dF/dtMIN (B). C, Sulfur-containing antioxidants did not alter dF/dtMAX. D, ERGO decreased dF/dtMIN (initial and nadir); NAC slowed the increase in dF/dtMIN as evidenced by a 1.6-fold increase in the time constant of the response (see text for further details). Data for panels (C) and (D) are mean ± SEM: control (solid gray line), NAC (solid black line), NACA (long-dashed line), ERGO (dotted line).

