
Figure 1.
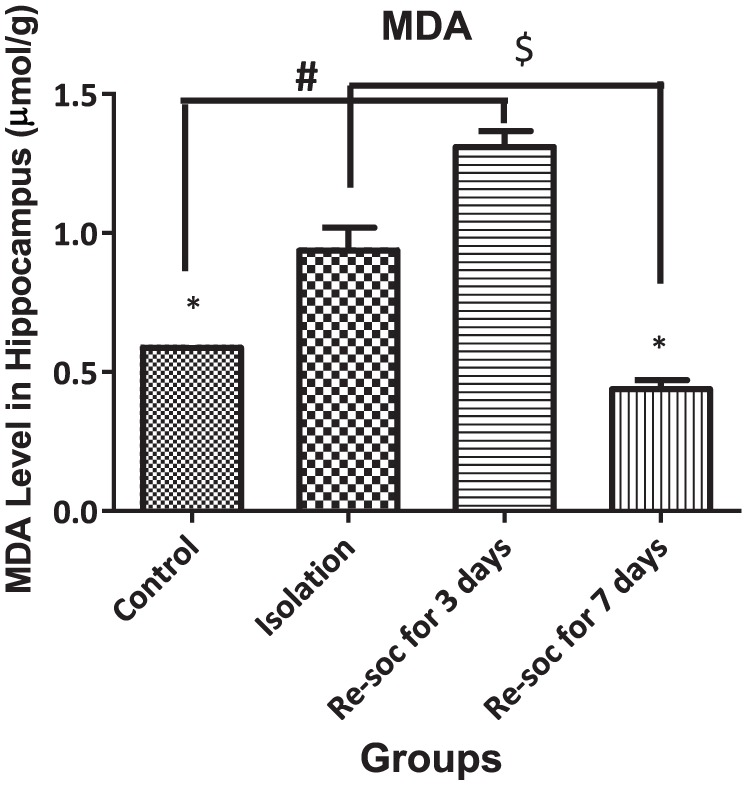
This figure shows MDA levels in the Hippocampus in all 4 groups. As the figure shows, after 7 days of resocialization, MDA levels returned to normal. Data were represented as mean ± SEM and P < .05 is considered significant (n = 8). * was used for groups that are adjacent (control × isolation and resocialization for 3 days (Resoc for 3 days) × resocialization for 7 days (Resoc for 7 days)) and for those groups that are not adjacent, the symbols # and $ were used. MDA indicates malondialdehyde.