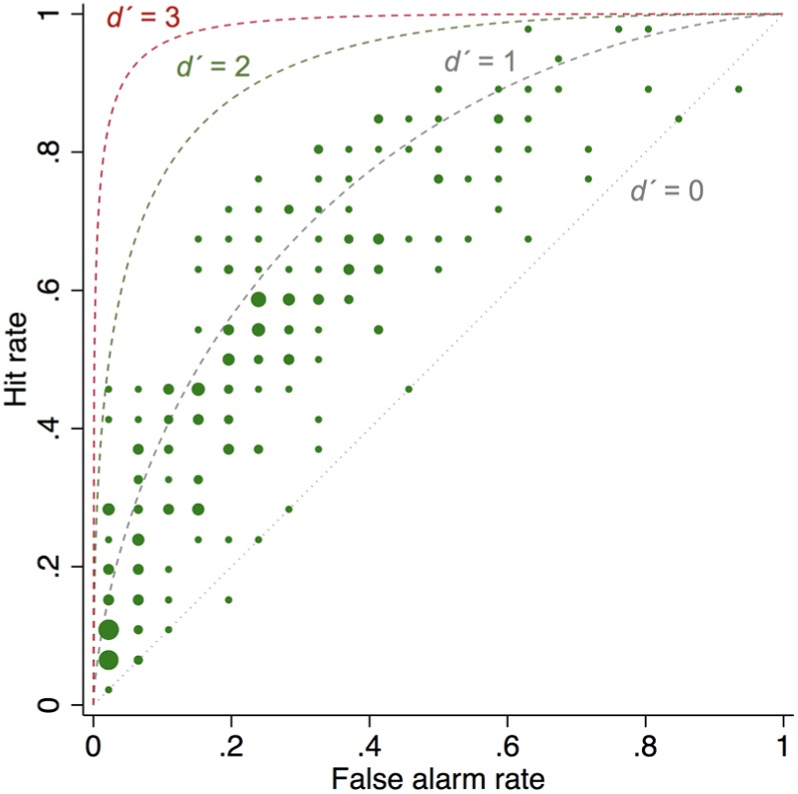
Figure 3.

Scatterplot of the hit and false alarm rates of the 216 general practitioners (GPs), with superimposed theoretical receiver operating characteristic curves produced by d ′ = 0, d ′ = 1, d ′ = 2, and d ′ = 3. The dots of the scatterplot are sized by frequency (number of GPs with the same hit and false alarm rates).
