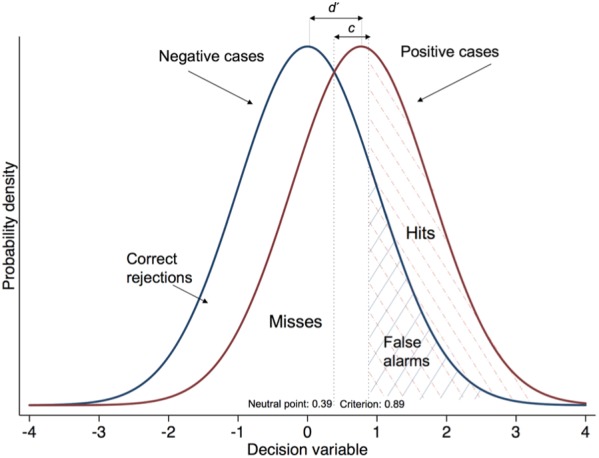
Figure 4.

Distribution of the decision variable across positive and negative case presentations based on the standardized hit and false alarm rates of the 216 general practitioners. The distribution for negative cases has a mean of 0 and that for positive cases a mean of 0.77 (i.e., the separation is 0.77, which is equal to the sample’s d ′). The sample’s c is 0.50, which is the distance between the neutral point (0.77/2 = 0.39) and the criterion location (0.39 + 0.50 = 0.89).
