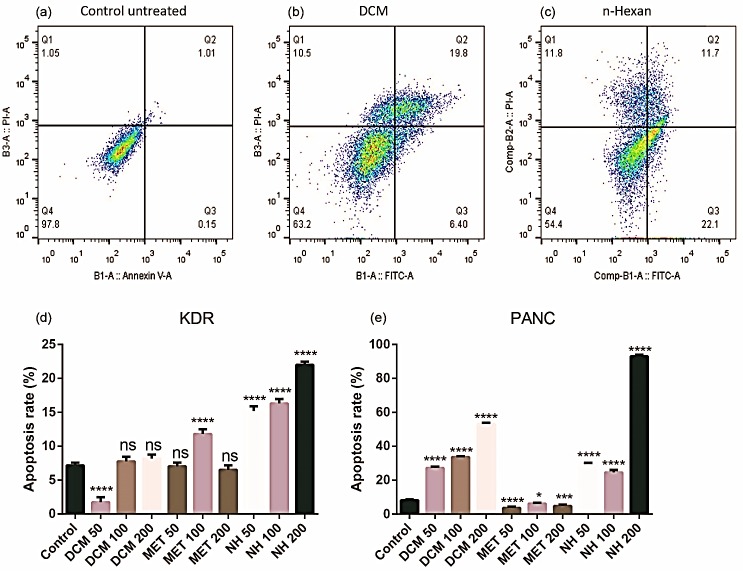
Figure 4.
Representative FACS plots of treated/untreated PANC-1 & KDR/293 cells. Cells were incubated with FITC-Annexin V in combination with PI to detect apoptosis and necrosis and classified as necrotic cells (the upper left quadrant (Q1); Annexin −/PI +), late apoptotic cells (the upper right quadrant (Q2); Annexin +/PI +), early apoptotic cells (the lower right quadrant (Q3); Annexin +/PI −) or intact cells (the lower left quadrant (Q4); Annexin −/PI −). (a): control untreated KDR cells, (b): DCM 50 µg/mL on PANC-1 cells, (c): n- hexan 50 µg/mL on PANC-1 cells. (d): Apoptosis rate in KDR cells. (e): Apoptosis rate in PANC-1 cells. *<0.05, ***<0.01, ****<0.001. NH: n-hexane; Met: methanol; DCM: dichloromethane.

