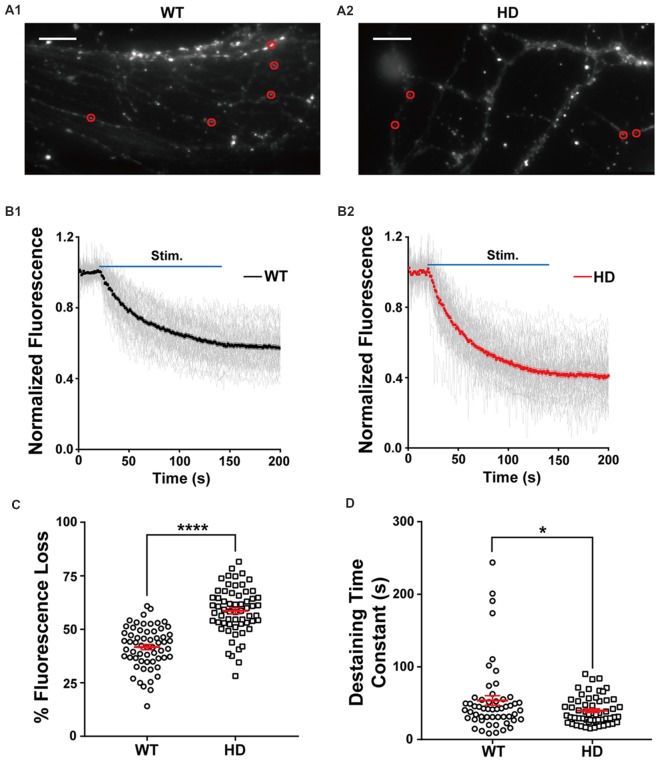
Figure 2.
HD cortical neurons have increased synaptic vesicle release. (A1,A2) Representative images of WT and HD cortical neurons loaded with FM 1–43. The red circles indicate the regions of interest (ROIs) representing presynaptic terminals that were analyzed for FM 1–43 release. The scale bars represent 10 μm. (B1,B2) Traces of normalized fluorescence intensity showing FM 1–43 destaining during 1,200 1-ms field stimuli applied at 10 Hz for 120 s in WT (n = 60 boutons, N = 7 experiments) and HD cortical neuron (n = 62 boutons, N = 8 experiments). (C) The percent fluorescence loss of FM 1–43 staining in WT and HD cortical neurons. (D) The time constant of FM 1–43 destaining in WT and HD cortical neurons. *p < 0.05 and ****p < 0.0001 (independent two-tailed Student’s t-test).

