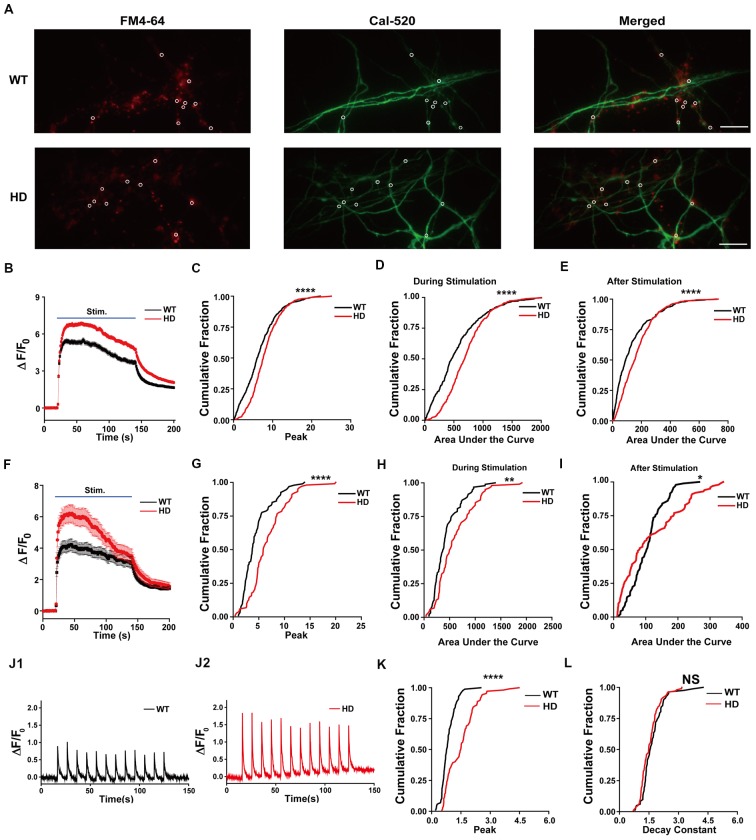
Figure 4.
HD cortical neurons increase presynaptic Ca2+ influx. (A) Representative images of WT and HD cortical neurons loaded with FM 4–64 (to label presynaptic terminals) and Cal-520 (an ultrasensitive fluorescence-based Ca2+ indicator). Cal-520 fluorescence was measured at FM 4–64-positive puncta (white circles) as the change in fluorescence relative to baseline fluorescence (ΔF/F0). The scale bar represents 10 μm. (B) Average ΔF/F0 traces measured before, during, and after field stimulation with 1,200 1-ms pulses delivered at 10 Hz for 120 s; n = 474 boutons in WT (N = 16 experiments) and n = 571 boutons in HD neurons (N = 15 experiments). (C) The peak ΔF/F0 of Cal-520 during the electrical stimulation. (D) Area under the curve of fluorescence change (ΔF/F0) during the stimulation. (E) Area under the curve of fluorescence change (ΔF/F0) after stimulation. (F) Average ΔF/F0 traces measured before, during, and after field stimulation with 1,200 1-ms pulses delivered at 10 Hz for 120 s in the presence of 50 μM AP5, 10 μM NBQX, and 1 μM calciseptine; n = 94 boutons in WT (N = 6 experiments) and n = 102 boutons in HD neurons (N = 9 experiments). (G) The peak ΔF/F0 of Cal-520 in the presence of 50 μM AP5, 10 μM NBQX, and 1 μM calciseptine during the electrical stimulation. (H) Area under the curve of fluorescence change (ΔF/F0) in the presence of 50 μM AP5, 10 μM NBQX, and 1 μM calciseptine during the stimulation. (I) Area under the curve of fluorescence change (ΔF/F0) in the presence of 50 μM AP5, 10 μM NBQX, and 1 μM calciseptine after stimulation. (J) Representative traces of ΔF/F0 traces measured at 10 Hz imaging frequency before, during, and after stimulation with 12 1-ms pulses delivered at 0.1 Hz for 120 s in WT (n = 86 boutons and N = 7 experiments; J1) and HD (n = 107 boutons and N = 6 experiments) neurons (J2). (K) Peak of ΔF/F0 measured after a single stimulus, averaged for single boutons. (L) Decay constant of ΔF/F0 after a single stimulus averaged for single boutons in WT (n = 86 boutons and N = 7 experiments) and HD (n = 107 boutons and N = 6 experiments) neurons. *p < 0.05, **p < 0.01, ****p < 0.0001 and NS, not significant (K-S test).

