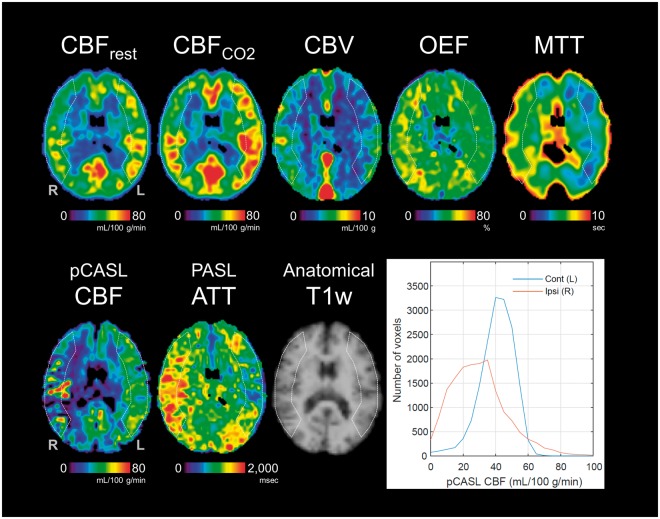
Figure 1.
PET and ASL maps acquired from a patient with occlusion of the right middle cerebral artery and histograms of pCASL CBF values in the ipsilateral and contralateral regions of interest (ROIs) (Patient No. 3). ROIs used in the analysis are overlaid on the maps. An individual, scalp-stripped T1-weighted image is also shown (used only for visualization).

