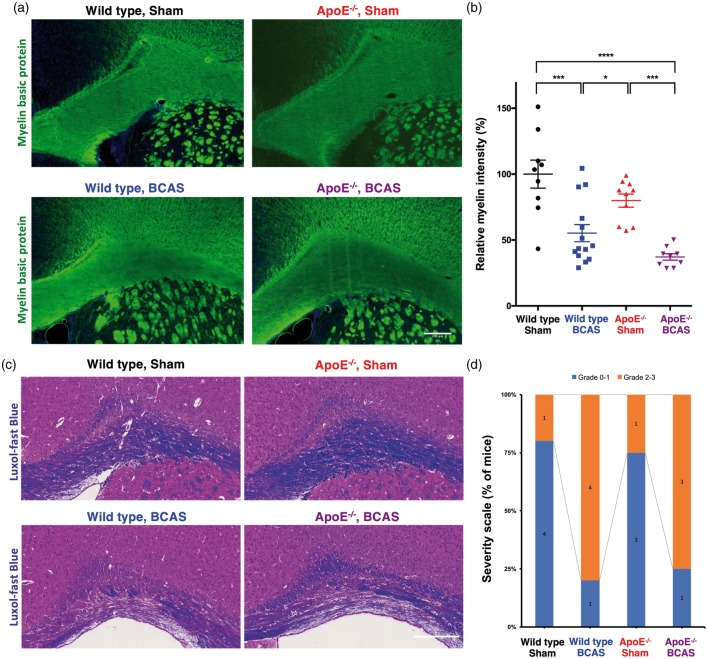
Figure 2.
White matter damages. (a) Representative images of white matter staining (immunofluorescence staining of myelin basic protein; scale bar, 200 µm). (b) Quantification of relative myelin density (mean ± s.e.m.; 9 wild-type sham, 14 wild-type BCAS, 10 ApoE−/− sham, and 9 ApoE−/− BCAS mice; significance for multiple comparisons: *P < 0.05; **P < 0.01; ***P < 0.001; ****P < 0.0001). Data are expressed as a percentage of the myelin density in wild-type sham-operated mice. (c) A representative image of white matter damage defined by LFB staining (scale bar, 200 µm). (d) Severity score of white matter damage from LFB staining. (Data are presented as number of mice; five wild-type sham, five wild-type BCAS, four ApoE−/− sham, and four ApoE−/− BCAS mice).

