Figure 5.
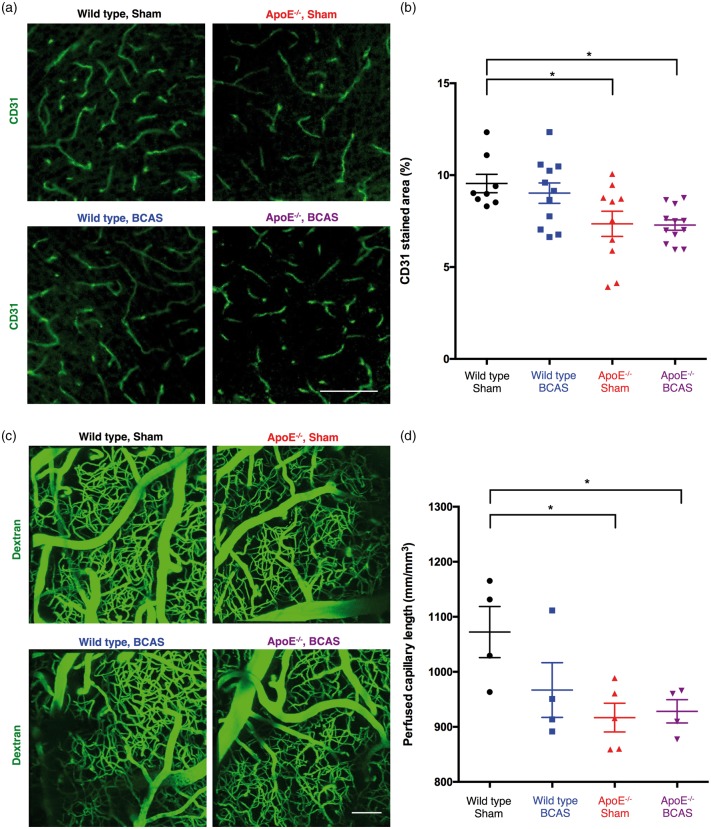
Reductions in cerebral microcirculation. (a) Representative images of CD31-stained microvessels. Scale bar, 500 µm. (b) Quantification of CD31-positive microvessels in the cortex. Mean ± s.e.m.; 8 wild-type sham, 11 wild-type BCAS, 10 ApoE−/− sham, and 12 ApoE−/− BCAS mice; significance for multiple comparisons: *P < 0.05. (c) Decreased perfused capillary length in ApoE−/− mice. Perfusion of cortical microvessels revealed by in vivo multi-photon microscopy of FITC-conjugated dextran. Scale bar, 100 µm. (d) Quantification of perfused capillary length. Mean ± s.e.m.; four wild-type sham, four wild-type BCAS, five ApoE−/− sham, and four ApoE−/− BCAS mice; significance for multiple comparisons: *P < 0.05.

