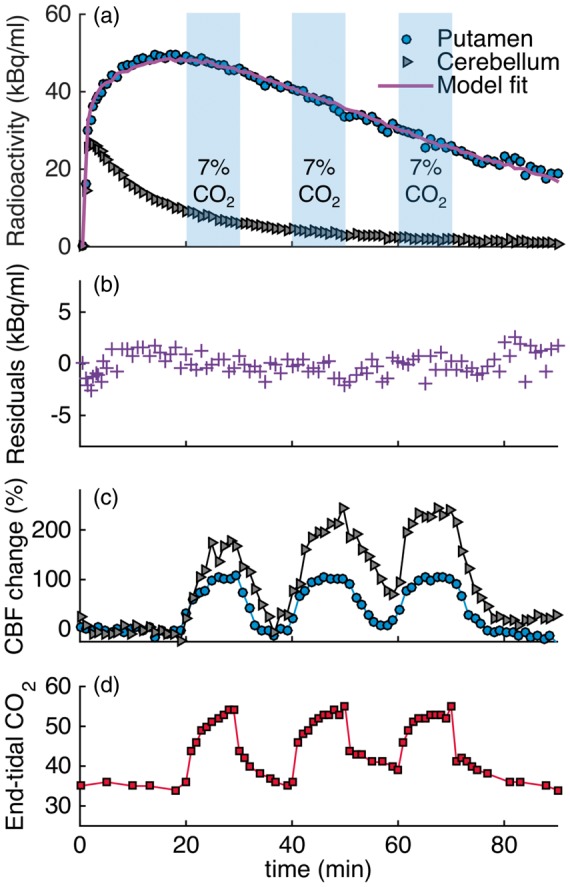
Figure 1.

Experimental results from a [11C]raclopride bolus injection and hypercapnia challenges of 7% CO2 applied three times during the session (3×CO2). (a) Time activity curves for putamen and cerebellum show no effects during hypercapnia (blue-shaded areas). (b) Residuals between the kinetic modeling fit and data do not show any pattern associated with the timing of the challenge. (c) Measured flow changes with pcASL show increases in flow in the putamen and cerebellum ROIs. (d) End-tidal CO2 values correspond to measured flow changes.
