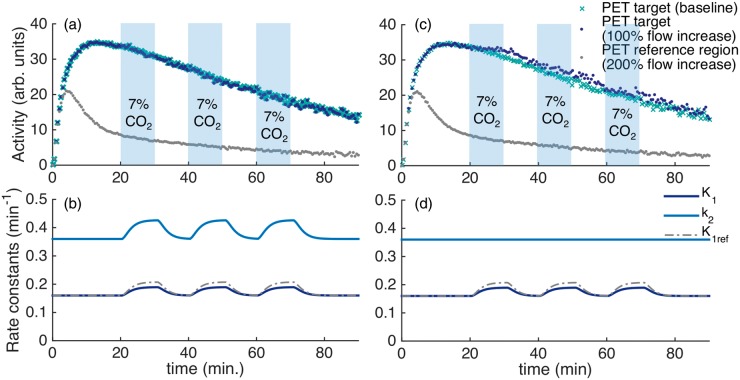
Figure 4.
Simulations of a reference tissue model with kinetic parameters for [11C]raclopride. (a) Time activity curves for the PET signal from a specific binding region show very small deviations compared to a baseline PET curve. (b) Timecourse of simulated rate constants K1, k2 with a 100% increase and with a 200% increase in cerebral blood flow starting at 20, 40 and 60 min for 10 min each. The increases in flow are chosen to be equivalent to the timing of hypercapnia applied in the experimental procedures. (c–d) Equivalent curves to (a–b), but in this simulation k2 is assumed to stay constant and did not change proportionally with K1. The TAC of the target region in (c) shows small increases during the periods of flow increase in this simulation.

