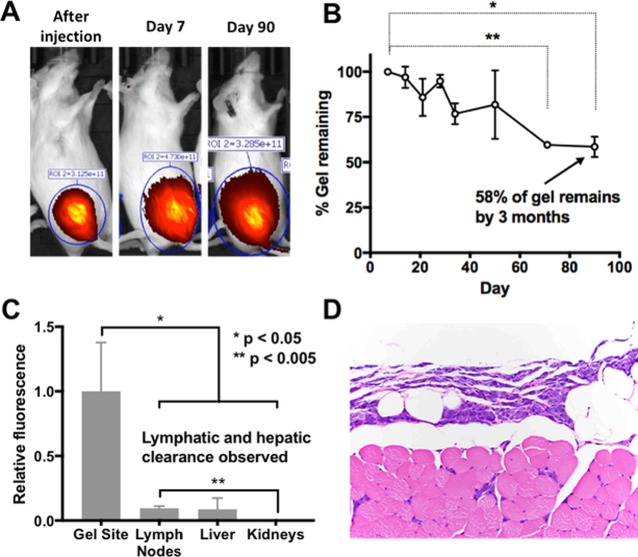
Figure 5.
In vivo behavior of TAG after injection. TAG covalently modified with Cy 5.5 was injected in the thigh muscle of a mouse (100 μL of 2.5% w/w solution). (A) The animal was imaged at different time points confirming the location of the hydrogel. (B) Percent of gel remaining determined by fluorescence intensity of gel injection site relative to day 7 postinjection value, error bars represent SEM of n = 3, paired one-way ANOVA, Dunnett’s post-test **p < 0.005, *p < 0.05. (C) Fluorescence distribution in organs. (D) Histopathological analysis of the gel site. Unpaired t test, error bars represent SEM of n = 3.

