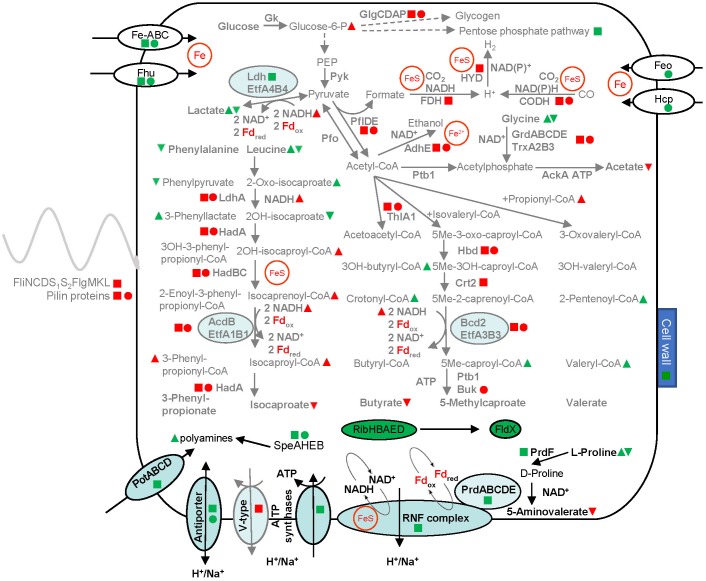
FIGURE 3.
Overview of the overall adaptation strategies of C. difficile to low iron conditions. Transcriptome (RNA-Seq), proteome and metabolome data were integrated into a general adaptation strategy model. Shown are enzymes (bold) and metabolites (non-bold), generally upregulated pathways are shown in black, while downregulated pathways are labeled in gray. The changes in abundance of the corresponding mRNAs, proteins and metabolites between low iron and high iron and/or a comparison between the fur mutant and the wild type strain are indicated in the following code: Transcriptome (RNA–Seq) data are shown as squares, proteome data as circles, metabolome data as triangles (cytoplasmic metabolome, peak up, exo-metabolome, peak down). Green indicates higher abundance and red indicates a reduction of the cellular abundances of the corresponding molecules. Filled symbols indicate the same effect in both conditions (high versus low iron and wild type versus fur mutant), open symbols indicate the effect in only one condition, blue symbols indicate contrary effects. Cut off values were a log2 fold change of 2 for transcriptome and proteome and a fold change of 1.5 for metabolic data. Iron-dependent reactions are labeled by brown circles and letters (Fd, ferredoxin; FeS, iron sulfur clusters, Fe2+). Fe-ABC, YclNOPQ; OH, hydroxy-group; CoA, coenzyme A; Me, methyl group. For details, see Table 1, and the Supplementary Tables.

