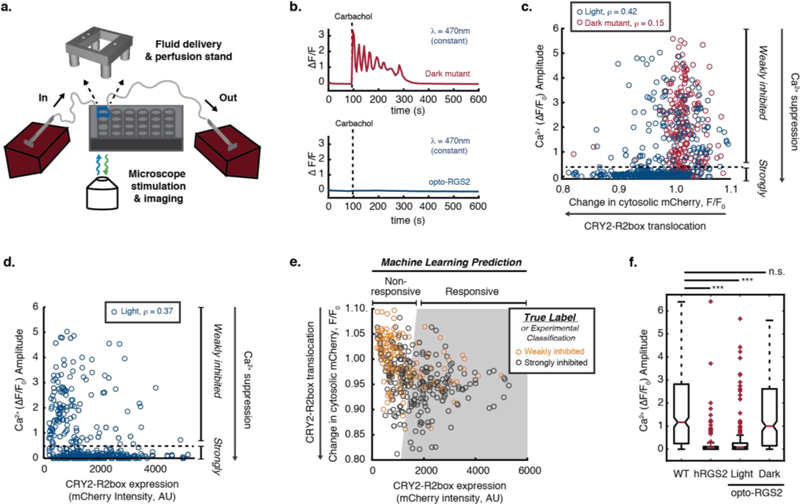
Figure 2. Opto-RGS2 functional determinants in transfected HEK cells.
(a) Experimental setup for single-cell functional assays of optogenetic suppression of carbachol-induced oscillations. (b) GCamp6f imaging traces of exemplar 30 uM carbachol (CCh)-induced calcium oscillations and optogenetic suppression. (Top) Red = Illuminated opto-RGS2 dark mutant or optically insensitive apoprotein control. (Bottom) Blue = Illuminated opto-RGS2 or flavin holoprotein. (c) Correlation analysis between oscillation suppression and CRY2-R2box translocation (inverse of change in cytosolic mCherry intensity (F/F0)). ρ = Spearman’s rank correlation coefficient. Cells with strong calcium suppression (calcium amplitude lower than 0.5, beneath the dashed line) are considered “strongly inhibited”. (d) Correlation analysis between oscillation suppression and CRY2-R2box expression. (e) Machine learning-predicted decision boundary for discriminating cells likely to suppress calcium levels robustly (predicted responsive, gray-shaded area) based on translocation efficiency and CRY2-R2box expression level. True Label = Classification from experimental data shown in panels c-d as training set. The boundary was optimized to maximize the true positive prediction with 80% precision, where 80% of “predicted responsive” cells are “strongly inhibited” experimentally. (f) Box-and whisker plot of calcium oscillation peak amplitude in wild-type HEK cells, constitutively active hRGS2 cells, opto-RGS2 dark mutant, and opto-RGS2 cells selected by the machine learning criteria from panel e (dataset distinct from the training set). N = 174–367.

