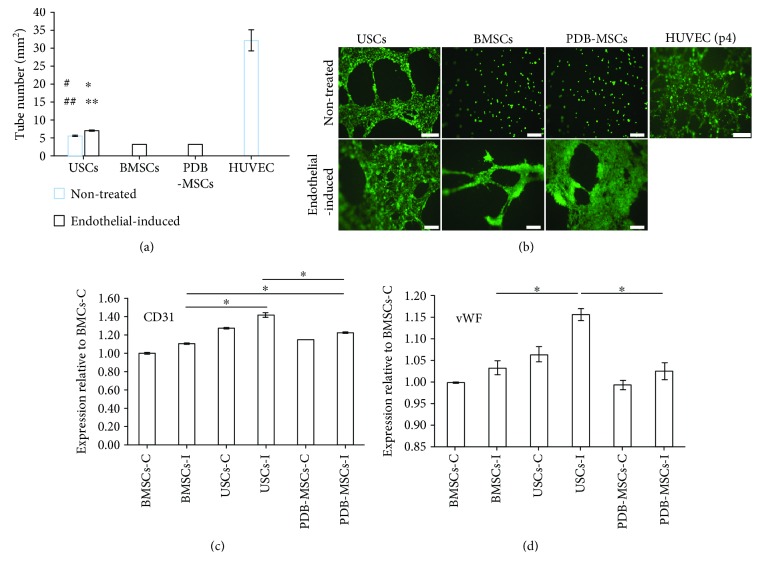
Figure 7.
Results of tube formation assay. (a) Quantitative evaluation of formed tube number in the USC, BMSC, and PDB-MSC groups, respectively (#P < 0.05, compared to BMSCs for nontreated group comparison; ##P < 0.05, compared to PDB-MSCs for nontreated group comparison; ∗P < 0.05, compared to BMSCs for endothelial differentiated group comparison; and ∗∗P < 0.05, compared to PDB-MSCs for endothelial differentiated group comparison). (b) Image of endothelial differentiated USCs, BMSCs, and PDB-MSCs and untreated cells cultured on Matrigel for 20 hours to form branched networks (angiogenesis) and tubular structures (scale bar = 200 μm); (c, d) mRNA expression of CD31 and vWF in USCs, BMSCs, and PDB-MSCs quantitated after 21 days of endothelial induction (∗P < 0.05). BMSCs: bone marrow-derived mesenchymal stem cells; PDB-MSCs: placenta decidua basalis-derived mesenchymal stem cells; USCs: urine-derived stem cells; C: control; I: introduced; HUVEC: human umbilical vein endothelial cells; vWF: von Willebrand factor.

