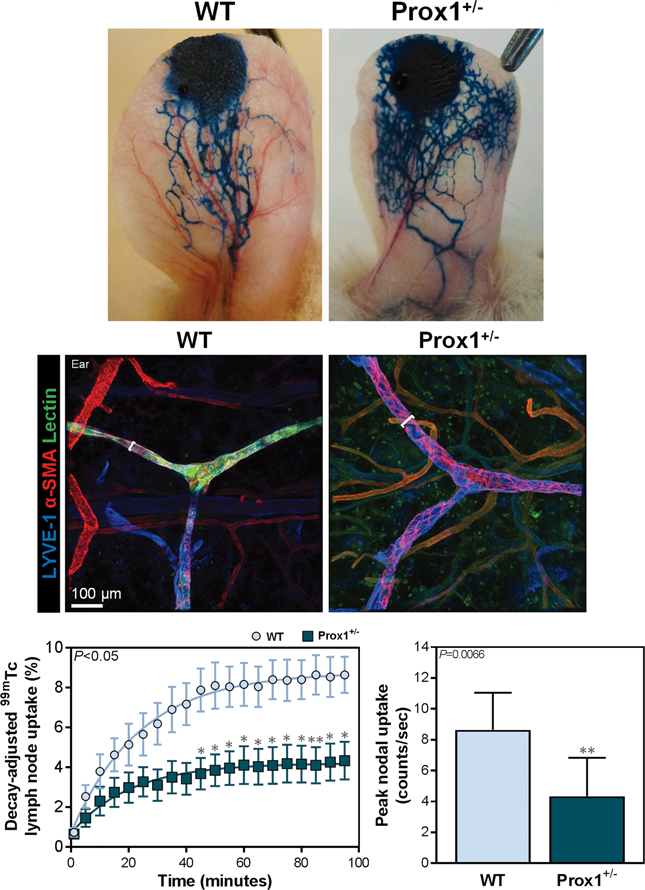
Figure 1. Prox1+/− mice have baseline lymphatic dysfunction.

A. Representative photographs of mouse ears after injection of Evans blue into anterior apices.
B. Representative immunofluorescent images of mouse ears co-localizing tomato lectin and LYVE+α-SMA+ lymphatic vessels, with brackets indicating lymphatic vessel diameter; scale bar, 100 μm.
C. Quantification of decay-adjusted uptake [left; two-way ANOVA, mean (S.E.M.); n=8/group, P<0.05], and peak nodal uptake (right; unpaired student’s t test, mean (S.D.); n=8/group; P=0.0066) of 99mTc by sacral lymph nodes after 99mTc injection into the distal tail.
