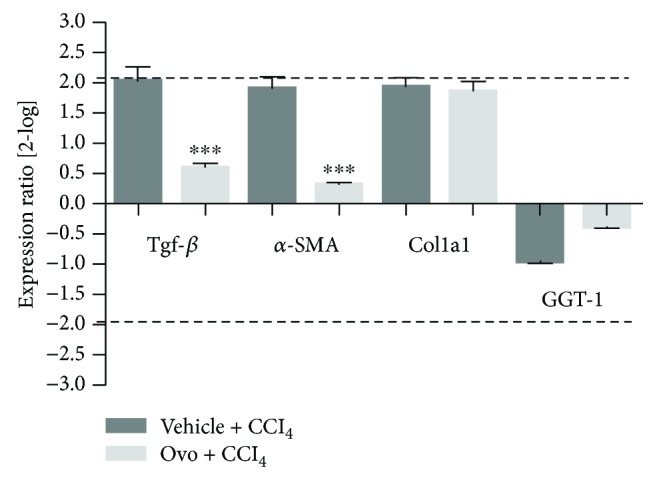
Figure 2.

Gene expression analysis of markers of liver fibrosis by real-time qPCR. The levels of gene expression of the fibrotic markers in tissues after treatment with ovothiol A or control solution were compared to tissues from healthy mice (reference baseline). Data were analyzed through the REST software, which considers fold differences ≥ +/−2 to be significant. (∗∗∗p < 0.001) represents the significance compared to the treated mice with vehicle + CCl4.
