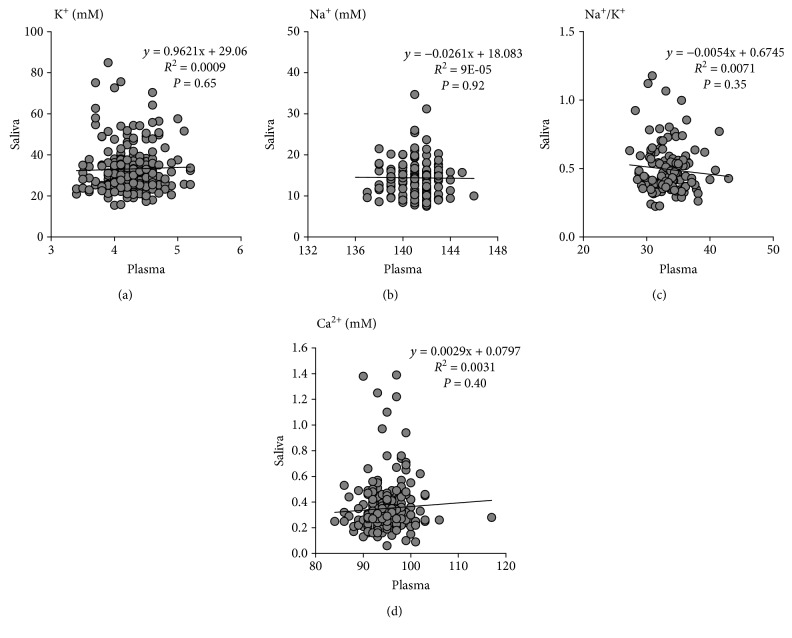
Figure 1.
Comparison between saliva and plasma electrolytes. The potassium concentrations were 10-fold higher in saliva compared with plasma (a), whereas sodium concentrations exhibited the reverse relation between saliva and blood (b). Consequently, the sodium to potassium ratio was inversed in the saliva, being 100-fold lower compared with plasma (c). There were no significant associations between saliva and plasma for potassium concentrations (a), sodium concentrations (b), or the sodium to potassium ratio (c). The salivary calcium levels were more than a 100-fold lower compared with plasma (d). There were no significant associations between saliva and plasma calcium concentrations (d). Pearson correlation coefficients and P values are indicated in each panel.

