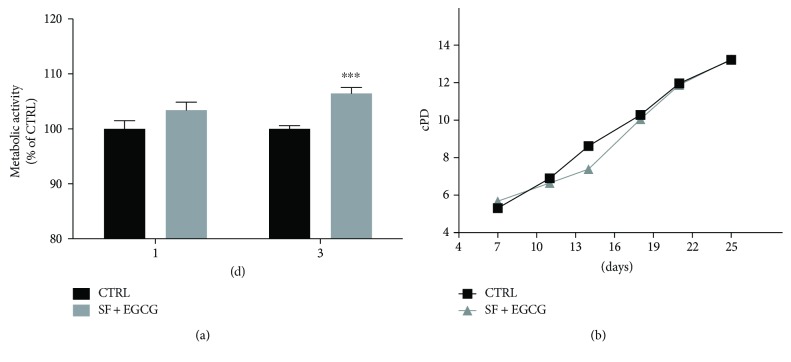
Figure 3.
Effect of the cotreatment with SF and EGCG on AFSC viability and proliferation. (a) Cells were cotreated with SF and EGCG and metabolic activity evaluated by PrestoBlue assay, as reported in Materials and Methods at 1 day and 3 days after treatment. Each bar represents means ± SEM of 3 independent experiments. Data were analysed by a Mann–Whitney test. ∗∗∗ p < 0.001 with respect to control cells. (b) Cells were cotreated chronically and expanded for 25 days in culture, and cPD was calculated as reported in Materials and Methods. Each dot represents means of 3 independent experiments.

