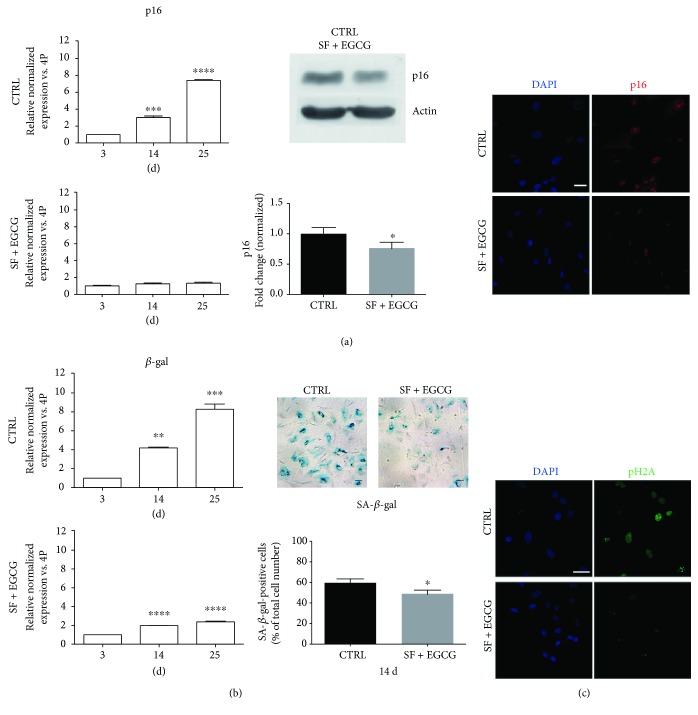
Figure 6.
Effect of AFSC cotreatment with SF and EGCG on senescence-associated markers. (a) Cells were cotreated for 3 days (3 d), 14 days (14 d), and 25 days (25 d) and analysed for p16 gene expression by real-time PCR. Each bar represents mean ± SEM of 3 independent experiments. Data were analysed by one-way ANOVA followed by Bonferroni's test. ∗∗ p < 0.01, ∗∗∗ p < 0.001, and ∗∗∗∗ p < 0.0001; cells were cotreated for 14 days and analysed for p16 protein levels by western blot analysis. β-Actin detection was performed as a loading control. The graph shows densitometric analysis of western blot experiment. Data are representative of three independent experiments. Data were analysed by Student's test. ∗ p < 0.05. Representative confocal images of AFSC, cotreated or not for 14 d, double stained with DAPI (blue) and p16 (red). Scale bar = 10 μM. (b) Cells were cotreated for 3 d, 14 d, and 25 d and analysed for β-gal gene expression by real-time PCR. Data were analysed by one-way ANOVA followed by Bonferroni's test. ∗∗ p < 0.01, ∗∗∗ p < 0.001, and ∗∗∗∗ p < 0.0001. Representative pictures of SA-β-gal staining and quantitative analysis of SA-β-gal-positive AFSCs are reported. Each bar represents means ± SEM of 3 independent experiments. Data were analysed by Student's test. ∗ p < 0.05. (c) Representative confocal images of AFSC, cotreated or not for 14 days, double stained with DAPI (blue) and pH2A (green). Scale bar = 10 μM.

