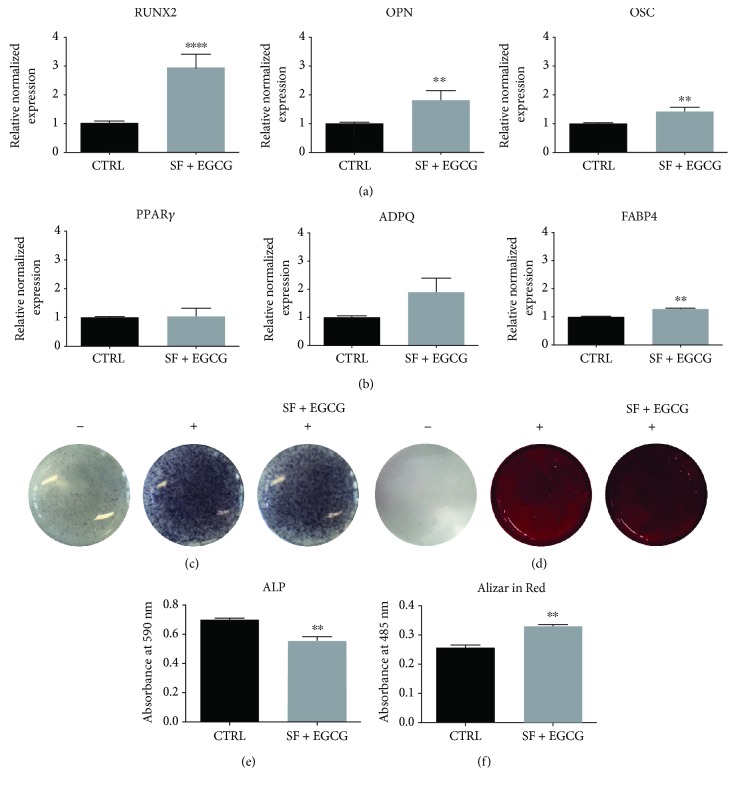
Figure 7.
Effect of cotreatment with SF and EGCG on osteogenic differentiation potential. (a) Effect of the treatment with SF and EGCG after 9 days on the expression of RUNX2, OPN, and OSC osteogenic markers and (b) of the adipogenic markers PPARγ, ADPQ, and FABP4 analysed by RT-PCR normalized to housekeeping genes as reported in Materials and Methods. Triplicate reactions were performed for each experiment. Each bar represents the mean ± SEM of 3 independent experiments. Data were analysed by a Mann–Whitney test. ∗∗ p < 0.01, ∗∗∗∗ p < 0.0001 in respect to the control (CTRL). (c) BCIP/NBT staining used to detect ALP activity in samples cotreated with SF and EGCG during osteogenic differentiation. (d) Alizarin Red staining used to detect calcium deposits in samples cotreated with SF and EGCG during osteogenic differentiation. (e) Spectrophotometric quantification of the results obtained with Alkaline Phosphatase Assay Kit. (f) Spectrophotometric quantification of solubilized Alizarin Red staining showed in (d). Data were analysed by unpaired t-test. ∗∗ p < 0.01, in respect to the control (CTRL). −: not induced to differentiation; +: induced to differentiation.

