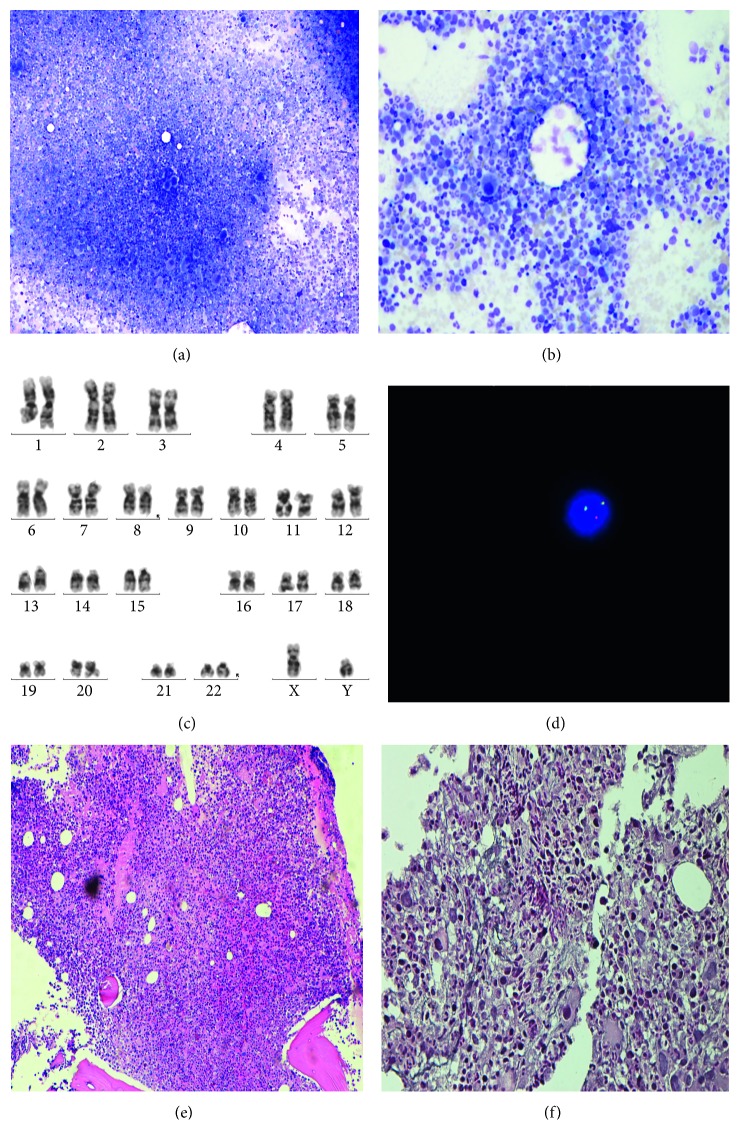
Figure 1.
Bone marrow: (a, b) Low magnification of the bone marrow aspirate showing myeloid hyperplasia and hypolobated megakaryocytes; (c, d) cytogenetic analysis showed a 46,XY,t(8;22)(p11;q11)[19]/46,XY[1]. Fluorescence in situ hybridization showed the split of one of the two fusion signals indicating a chromosome breakage in the FGFR1 locus; (e) low magnification of the bone marrow biopsy showing hypercellular marrow (hematoxylin and eosin); (f) reticulin stain demonstrating a mild grade of fibrosis.

