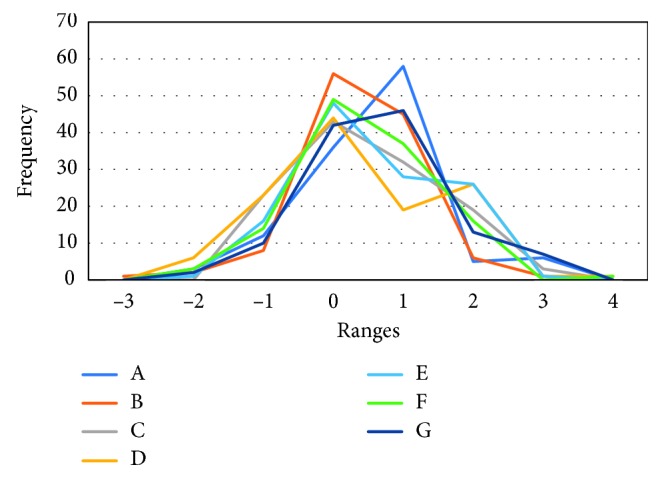
Figure 4.

This is the frequency polygon for each subject used in the threshold calculation. To organize the class values for each subject when creating the frequency polygon, normalization was performed on the data of each subject used in the threshold calculation, according to Equation (5). Additionally, as the number of data items was 120, the number of classes was set to 8 based on Equation (6). The classes were set to −3, −2, −1, 0, 1, 2, 3, 4. For subjects other than subject B, all of the 120 data items for each subject were contained within the class in the diagram. As subject B had one data item within the −4 class, the figure is drawn based on 119 data items.
