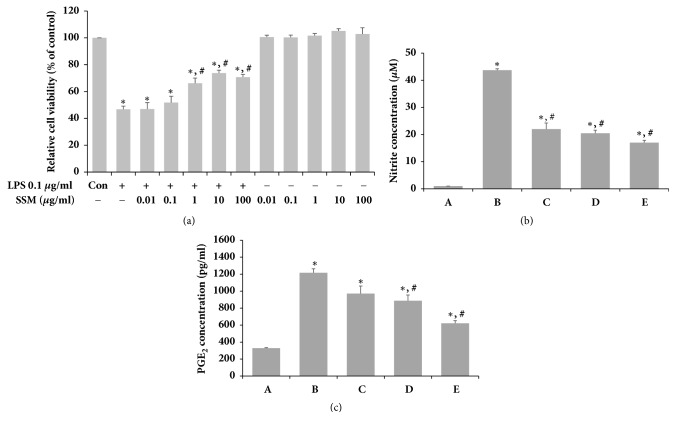
Figure 2.
Effects of SSM on LPS-induced cell viability, NO, and PGE 2 in RAW 264.7 cells. RAW 264.7 cells were induced with 1 μg/mL LPS and various concentrations of SSM or with various concentrations of SSM alone for 24 h. (a) The cells were stained using the MTT method. (b) The production of NO in the culture medium was analyzed with a commercial NO detection kit. (c) The PGE2 contents in the culture medium were analyzed using a competitive enzyme immunoassay. (A) Control group, (B) 1 μg/mL LPS-administered group, (C) 1 μg/mL LPS-administered and 0.1 μg/mL SSM-treated group, (D) 1 μg/mL LPS-administered and 1 μg/mL SSM-treated group, and (E) 1 μg/mL LPS-administered and 10 μg/mL SSM-treated group. The results are presented as the means ± standard errors of the mean (SEMs). ∗P<0.05 compared to the control group. #P<0.05 compared to the LPS-induced group.

