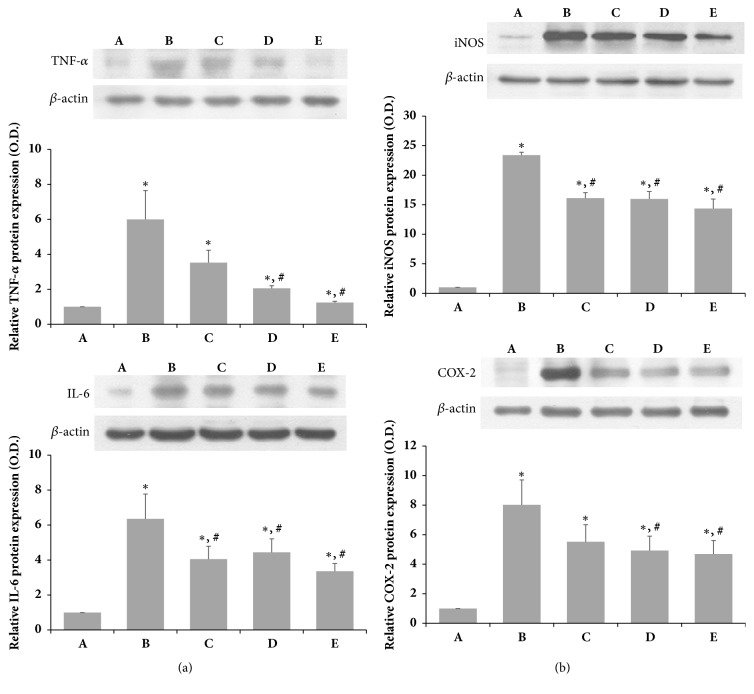
Figure 7.
Effects of SSM on SNCI-induced protein expression of TNF-α, IL-6, iNOS, and COX-2. The sciatic nerve was crushed for 30 s using a surgical clip. (a) Relative protein expression levels of TNF-α and IL-6. (b) Relative protein expression levels of iNOS and COX-2. Bands were detected using an enhanced chemiluminescence (ECL) detection kit. Actin was used as an internal control (46 kDa). (A) Sham operation group, (B) SNCI-induced group, (C) SNCI-induced and 0.1 g/kg SSM-treated group, (D) SNCI-induced and 1 g/kg SSM-treated group, and (E) SNCI-induced and 10 g/kg SSM-treated group. The results are presented as the means ± standard errors of the mean (SEMs). ∗P<0.05 compared to the sham operation group. #P<0.05 compared to the SNCI-induced group.

