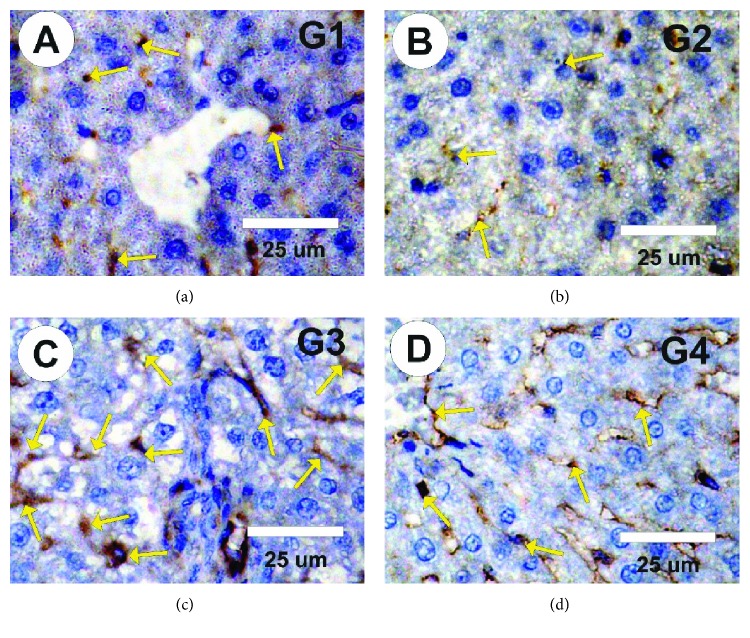
Figure 8.
Photomicrographs of rat liver sections in the different experimental groups stained with P53. (a, b) Faint positive reactions for P53 expression (arrows) in control and in rats treated with MLE. (c) Moderate to strong positive reactions for P53 expression (arrows) in rats treated with vetsin. (d) Mild positive reactions for P53 expression (arrows) in liver sections of rats treated with vetsin and MLE.

