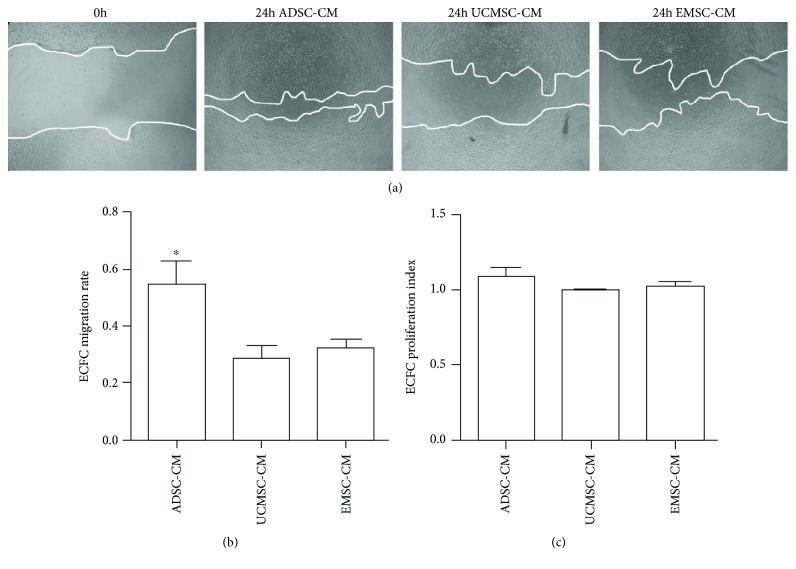
Figure 8.
Effect of MSC-CMs on migration and proliferation of ECFCs. (a) Representative images of ECFCs wound healing assay in different MSC-CMs (×40). ECFCs monolayer was scratched on 0 h, and the medium was replaced by ADSC-CM, UCMSC-CM, and EMSC-CM, respectively. EBM-2 was used as control. Images of scratch area were captured after 24 h. (b) The quantification of ECFCs migration ratio in different mediums. The ratio of migration was defined as follows: (blank area on 0 h – blank area on 24 h)/blank area on 0 h. Bars represent mean ± SD. ∗ P < 0.05. N = 3. (c) The quantification of ECFCs proliferation index in different mediums. Proliferation index was quantified by MTT measurement. Bars represent mean ± SD. ∗ P < 0.05. N = 3.

