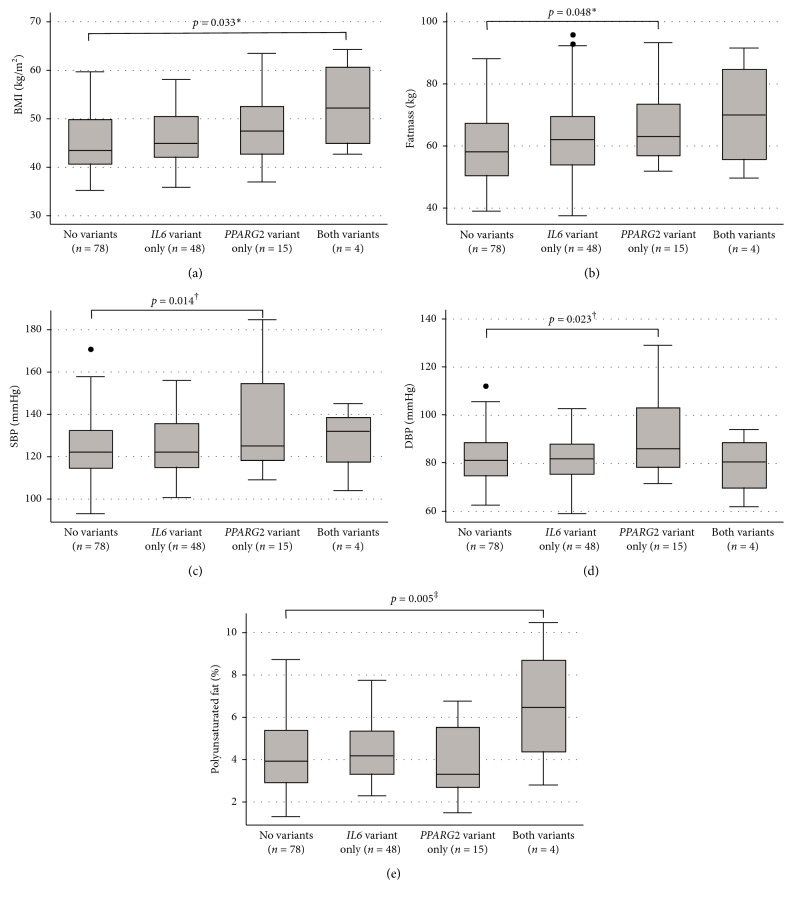
Figure 1.
Comparison of BMI (a), fat mass (b), SBP (c), DBP (d), and percentage of polyunsaturated fat consumption (e) between different genotype combinations in severely obese patients. BMI: body mass index; SBP: systolic blood pressure; DBP: diastolic blood pressure. Results are expressed as median (percentiles 25–75%). Dots represent outlier values. ∗Adjusted for age, gender, and sedentary time. †Adjusted for age, gender, sedentary time, BMI, and diabetes. ‡Adjusted for age, gender, BMI, and diabetes.

