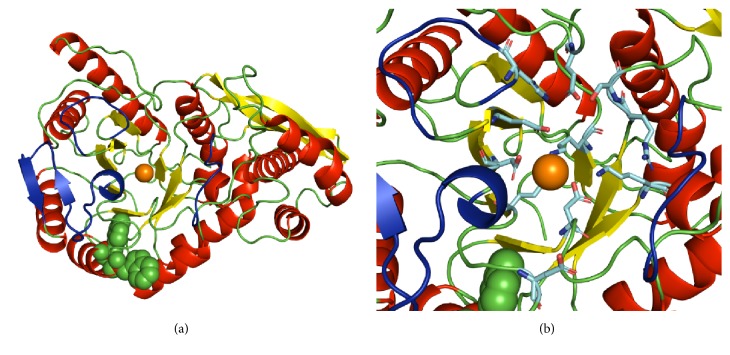
Figure 4.
Ribbon representation of the structure HpEnomonomer. β-Strands are coloured in yellow, and α-helices are red. Tryptophans (W294 and W297) are shown as green spheres. The orange sphere represents a Mg2+ ion in the model that was obtained by SWISS-MODEL and rendered using PyMOL. Loops of the active site (L1, L2, and L3) are coloured in dark blue. In panel (b), the side chains of catalytic residues are shown.

