
Figure 11.
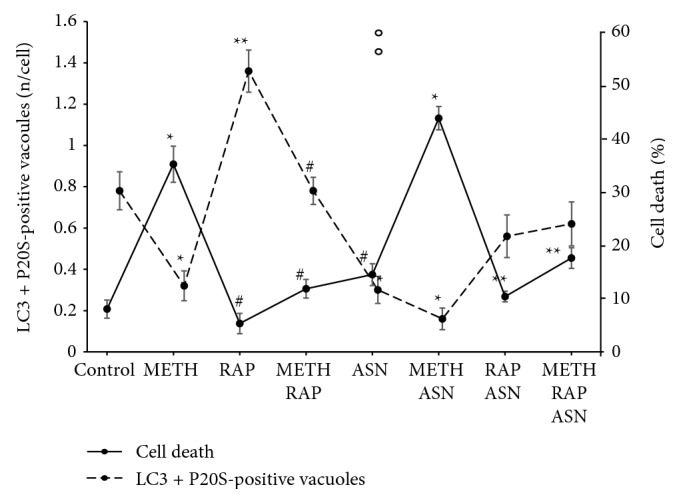
Inverse correlation between cell death and amount of APPs following mTOR modulation. The dashed line shows the amount of APPs while the continuous line shows the percentage of cell death. For each treatment, the values of the two lines produce a mirror image, which indicates a negative correlation. ∗ p ≤ 0.05 vs. control; ∗∗ p ≤ 0.05 vs. control and METH; # p ≤ 0.05 vs. METH. ASN = asparagine; RAP = rapamycin.