Figure 2.
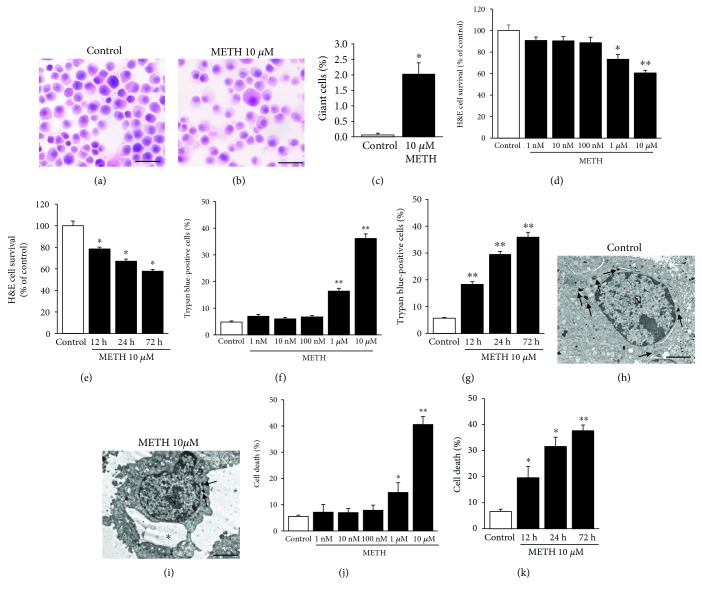
METH induces cell death time- and dose-dependently with a maximal effect at the 1 μM and 10 μM doses. (a) Representative H&E-stained picture from controls. (b) Representative H&E-stained picture following 10 μM METH at 72 h. (c) Graph reporting the percentage of giant cells counted in H&E-stained total cells from controls and METH at 72 h. (d) Dose-dependent graph of H&E-stained cells from control and METH at 72 h. (e) Time-dependent graph of H&E-stained cells from control and 10 μM METH-treated cells. (f) Dose-dependent graph of trypan blue-stained cells from control and METH at 72 h. (g) Time-dependent graph of trypan blue-stained cells from control and 10 μM METH-treated cells. (h) Representative micrograph from a control cell. (h) Representative micrograph from a control cell. (i) Representative micrograph from a METH cell at 72 h. (j) Dose-dependent graph of cell death from control and METH at 72 h. (m) Time-dependent graph of cell death from control and 10 μM METH-treated cells. For the graphs in (c)–(g), values are given as the percentage of cell counted in two triplicates (n = 6). For the graphs in (j) and (k), values are given as the percentage of cell counted on 5 grids. Error bars represent the standard error of the mean. ∗ p ≤ 0.05 vs. control, ∗∗ p ≤ 0.05 vs. other groups. Arrows point to vacuoles; asterisk (∗) indicates a large vacuole. N = nucleus. Scale bar = 23.4 μm (a, b) and 2 μm (h, i).

