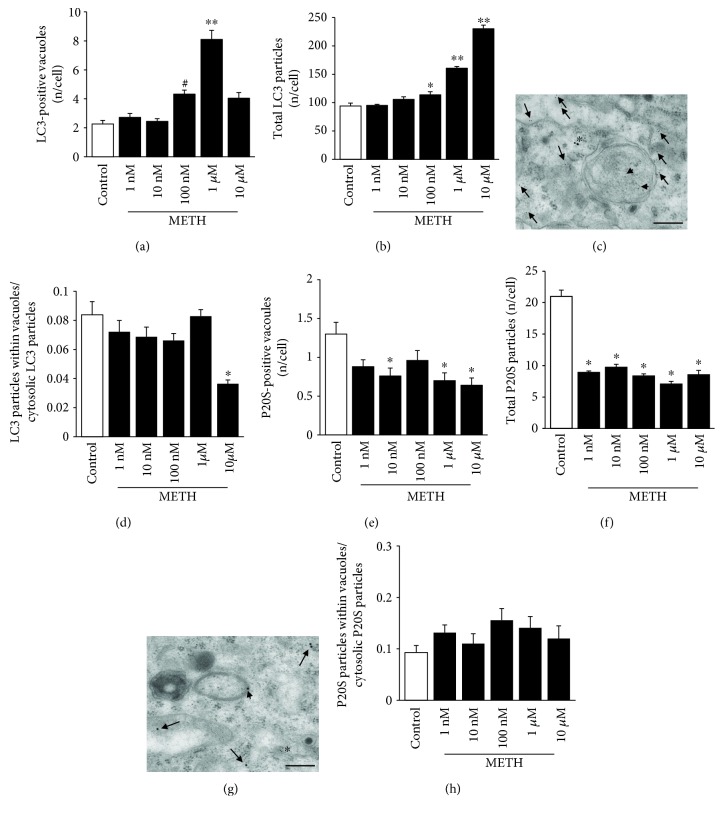
Figure 3.
METH alters the amount and placement of LC3 and P20S particles dose-dependently, with P20S being more sensitive than LC3. (a) Dose-dependent graph of the number of LC3-positive vacuoles per cell from controls and METH at 72 h. (b) Dose-dependent graph of total LC3 particles per cell from controls and METH at 72 h. (c) Representative micrograph of LC3-positive vacuole from 10 μM METH at 72 h. (d) Dose-dependent graph of the ratio between the numbers of LC3 particles within vacuoles with respect to cytosolic LC3 particles from controls and METH at 72 h. (e) Dose-dependent graph of the number of P20S-positive vacuoles per cell from controls and METH at 72 h. (f) Dose-dependent graph of total P20S particles per cell from controls and METH at 72 h. (g) Representative micrograph of P20S-positive vacuoles from 10 μM METH at 72 h. (h) Dose-dependent graph of the ratio between the numbers of P20S particles within vacuoles with respect to cytosolic P20S particles from controls and METH at 72 h. Values are given as the mean number of LC3 or P20S particles and vacuoles counted in 50 cells per group. Error bars represent the standard error of the mean. ∗ p ≤ 0.05 vs. control; ∗∗ p ≤ 0.05 vs. other groups; # p ≤ 0.05 vs. control and 1 nM and 10 nM METH. Arrows point to free cytosolic LC3 (10 nm) or P20S (20 nm); arrowheads point to LC3 (10 nm) or P20S (20 nm) within vacuoles; asterisk (∗) indicates P20S in the cytosol (c) and LC3 in the cytosol (g). Scale bar = 200 nm.

