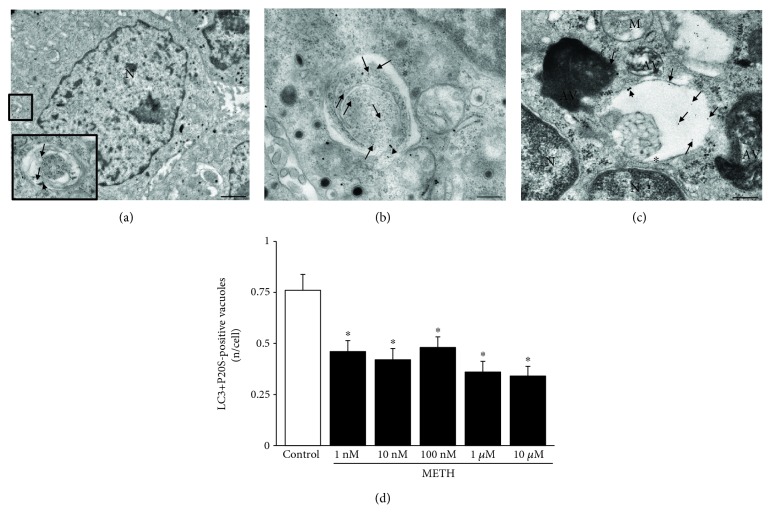
Figure 5.
METH reduces the occurrence of autophagoproteasomes (APPs) dose-dependently. (a) Representative picture of a PC12 cell (low magnification) and an APP vacuole (high magnification). (b, c) Representative pictures of APP vacuoles stained for both LC3 (10 nm) and P20S (20 nm) immunogold particles. (d) Dose-dependent graph of the number of LC3 + P20S-positive vacuoles per cell from control and METH at 72 h. Values are given as the mean number of LC3 + P20S-positive vacuoles counted in 100 cells per group. Error bars represent the standard error of the mean. ∗ p ≤ 0.05 vs. control. Arrows point to free LC3 particles (10 nm); arrowheads point to P20S particles (20 nm); asterisk (∗) indicates a double membrane (b, c). N = nucleus; AV = autophagic vacuoles; M = mitochondrion. Scale bar = 220 nm.

