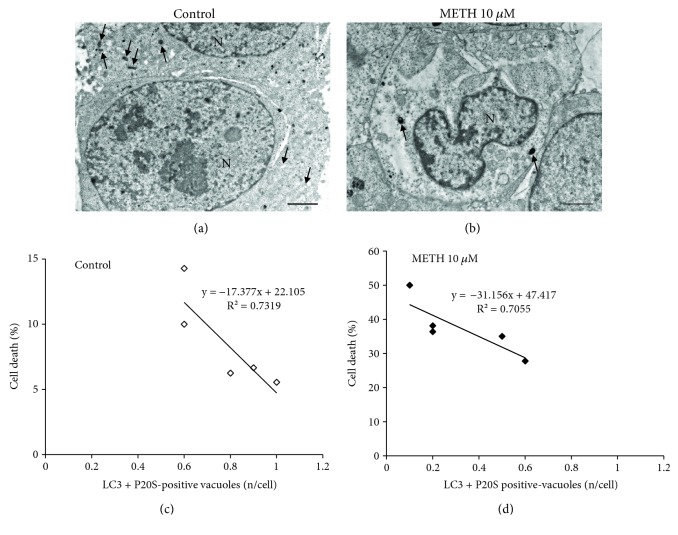
Figure 6.
Inverse correlation between the occurrence of APP and METH-induced toxicity. (a) Representative micrograph from a control cell. (b) Representative micrograph from a cell following METH at 72 h. (c) Linear regression between the percentage of cell death and the number of LC3 + P20S-positive vacuoles in control. (d) Linear regression between the percentage of cell death and the number of LC3 + P20S-positive vacuoles following METH at 72 h. The puncta reported in the graphs ((c) white square and (d) black square) correspond to the number of grid (n = 5). Arrows point to vacuoles. N = nucleus. Scale bar = 1 μm.

