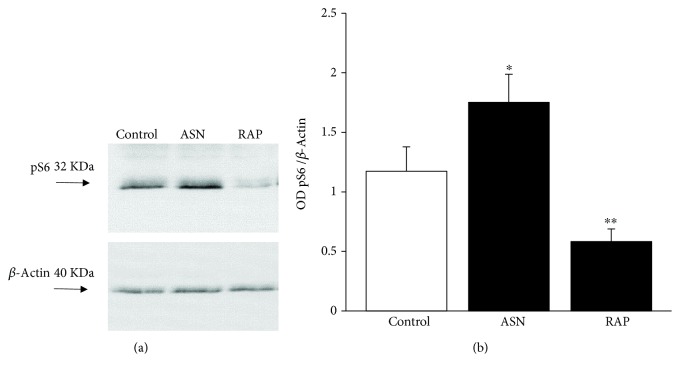
Figure 7.
Modulation of pS6 levels underlie mTOR inhibition and activation by rapamycin and asparagine, respectively. (a) Representative SDS-PAGE immunoblotting of pS6 protein. (d) Densitometric analysis. Values are given as the optical density detected in six separate replicates (n = 6). Error bars represent the standard error of the mean. ∗ p ≤ 0.05 vs. control; ∗∗ p ≤ 0.05 vs. control and METH. ASN = asparagine; RAP = rapamycin.

