Figure 2.
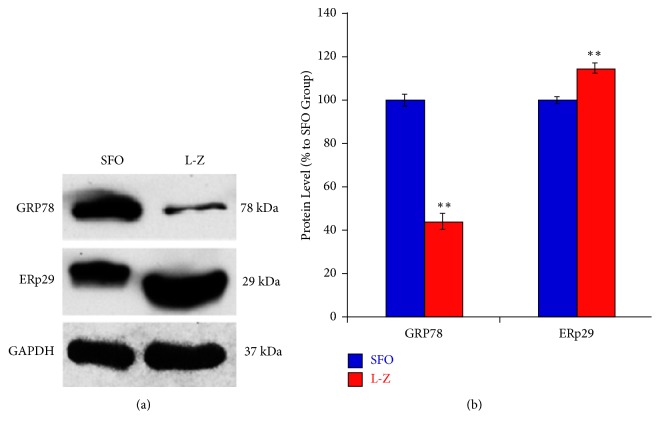
Western blot results of ER stress protein markers (GRP78 and ERp29) in the L-Z treatment group and the SFO group. (a) Representative images of western blot for GPR78. (b) Average protein expression of GRP78 (n = 3) in both L-Z-treated and SFO groups. ∗∗ p < 0.01 versus SFO group. The GRP78 was significantly downregulated in the L-Z group than that of the SFO group, while the ERp29 was significantly upregulated in the L-Z group compared to that of the SFO group.

