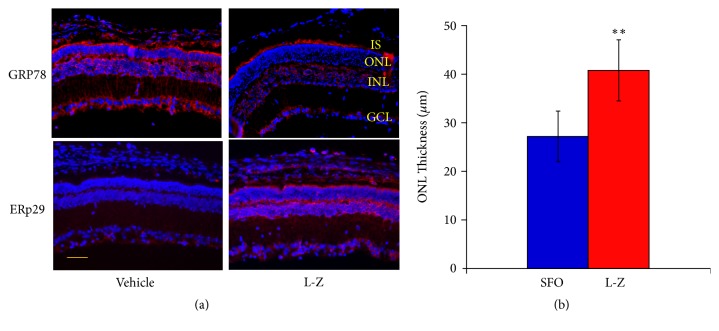
Figure 3.
Immunostaining results of GRP78 and ERp29 in the L-Z treatment group and the SFO group. (a) Representative images (20x) of retinal immunostaining for GRP78 and ERp29. Scale bar indicates 50 μm. The GRP78 was markedly downregulated in several retinal layers in the L-Z group than that of the SFO group, while the ERp29 was markedly upregulated in some retinal layers in the L-Z group compared to that of the SFO group. (b) The ONL thickness (mean ± SD) based on the DAPI staining in these images was significantly increased in the L-Z group than in the SFO group. IS: inner segment; ONL: outer nuclear layer; INL: inner nuclear layer; GCL: ganglion cell layer. n = 3. ∗∗ p < 0.01 versus SFO group.

