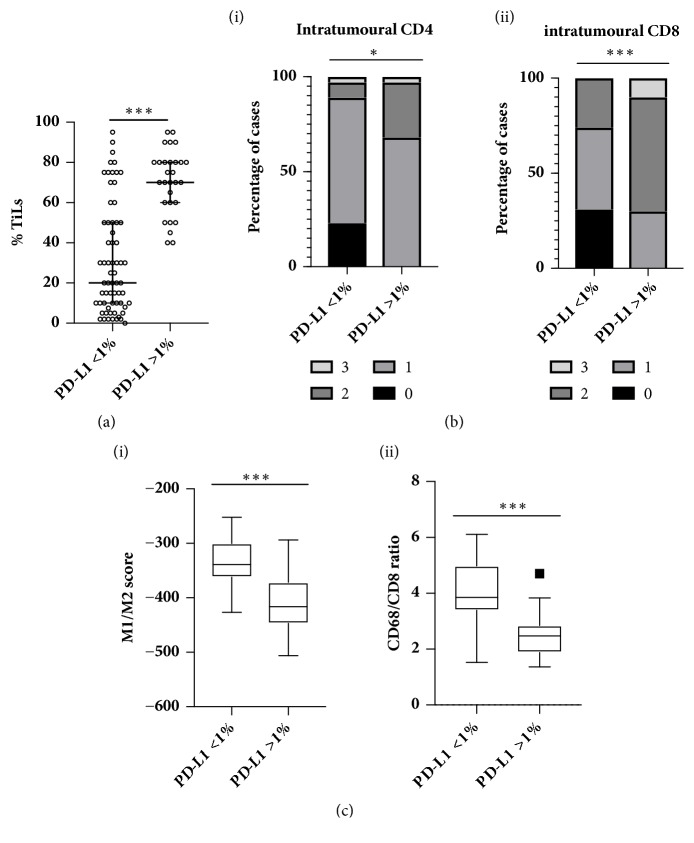
Figure 5.
(a) Scatter plot of percentage stoma TILs (median and interquartile range indicated) in cases determined to be low (<1%) or high (>1%) for PD-L1 expression (whole core assessment) in the tumour rich cores. (b) Intratumoural (i) CD4 and (ii) CD8 expression in PD-L1 low (<1%) and high (>1%) samples. (c) Box and whisker plots of gene expression derived (i) M1/M2 signature scores and (ii) CD68/CD8 ratio in PD-L1 low (<1%) and high (>1%) samples.

