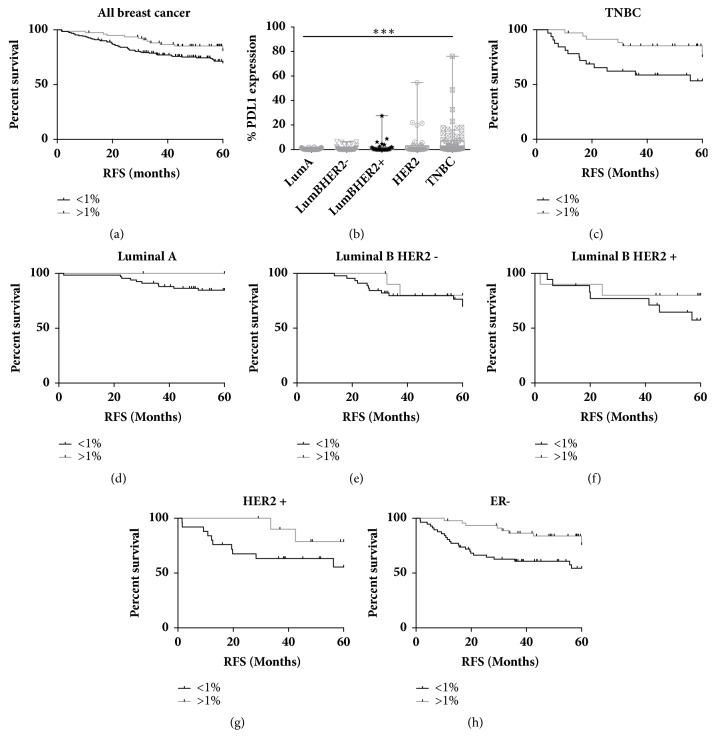
Figure 6.
(a) Kaplan Meier Plots of relapse free survival stratified based on PD-L1 expression above or below 1% in breast cancer as a whole. (b) Box and whisker plot showing the range (min. to max.) of PD-L1 expression in the different subtypes of breast cancer. Kaplan Meier Plots of relapse free survival stratified based on PD-L1 expression above or below 1% in (c) TNBC, (d) Luminal A, (e) Luminal B/HER2 negative, (f) Luminal B/HER2 positive, (g) HER2 positive, and (h) ER negative breast cancer.

