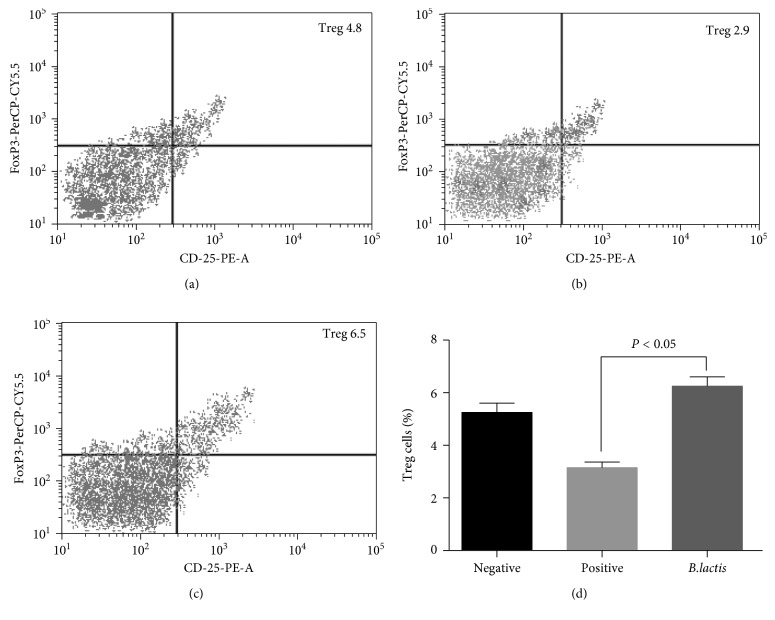
Figure 6.
The effects of B. lactis on the percentage of Treg cells in mouse allergy models. (a) The percentage of Treg cells in the NG. (b) The percentage of Treg cells in the PG. (c) The percentage of Treg cells in the EG. (d) The effects of B. lactis on the percentage of Treg cells. BALB/c mice were randomly divided into 3 groups (n = 8 in each group): negative control group (NG), positive control group (PG), and experiment group (EG). The mice from PG and EG were individually immunized with tropomyosin and cholera toxin. The mice from NG received cholera toxin in PBS. Subsequently, the mice from EG received B. lactis. CD4+ T cells were gated by CD4 expression and forward scatter characteristics. The statistical difference was significant if P < 0.05.

