
Figure 1.
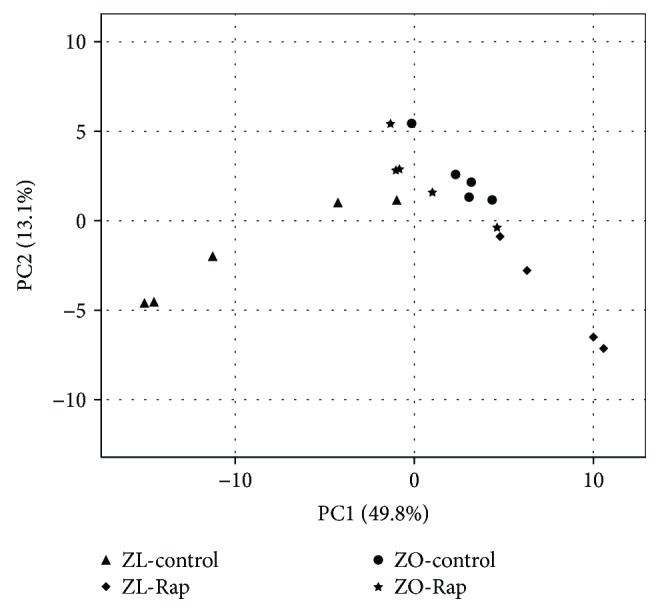
PCA analysis of the 70 miRNAs determined to be differentially expressed (p < 0.05) by at least 1.5 log2-fold between one or more groups. Comparisons revealed three moderately distinct clusters (1) ZL-control (ZL-C), (2) ZL-Rap, and (3) ZO-control (ZO-C) and ZO-Rap.