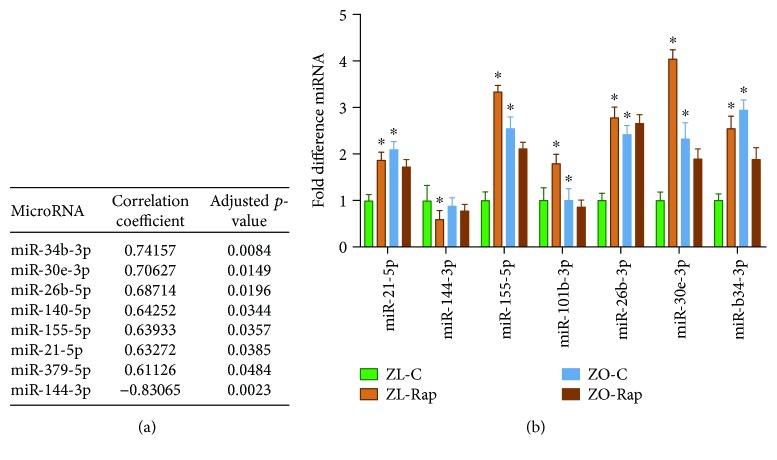
Figure 7.
(a) Correlation coefficients and p values of fibrotic scores and differentially expressed miRNA from all groups. (b) Comparative miRNA expression levels of several miRNAs that were associated with cardiac fibrosis scores. Data represents means ± SEM. n = 4 for all groups. ∗ p < 0.05 vs. the ZL-C group.

