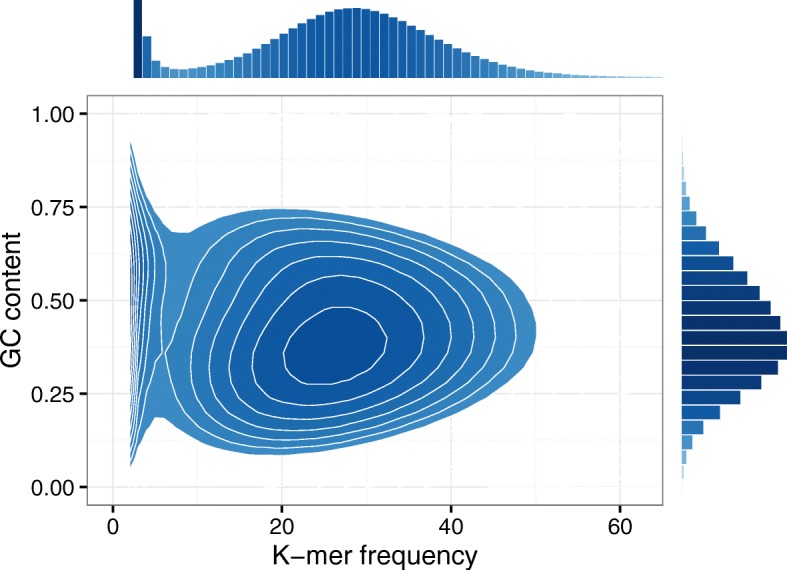
Fig. 3.

A relation between k-mer frequency and GC-content. The bottom left panel shows the smoothed scatter plot between k-mer frequency and GC-content, the top left is the distribution of k-mer frequency, and the bottom right is the distribution of GC-content. It is clear that GC-content k-mers have relatively low frequency. The data shown in this example is obtained from the H. chromosome 14 with k-mer size of 25
