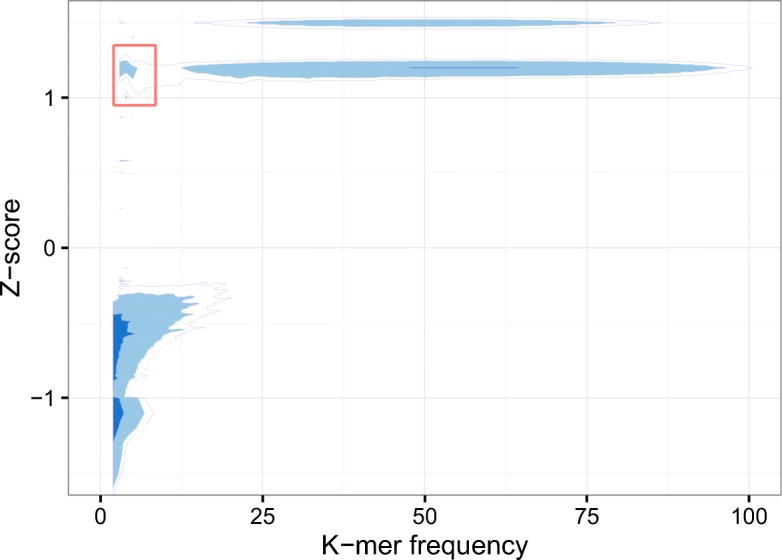
Fig. 4.

A relation between z-score and k-mer frequency. The level of shade represents the density of the distribution. The darker the color is, the more k-mers are presented. The frequencies of the k-mers highlighted in the red box are less than nine, which are very likely to be treated as weak for all existing k-mer based approaches. However, the very high z-score reflects that they should be treated as solid k-mers. The data shown here is obtained from B. impatiens with k-mer size of 25
