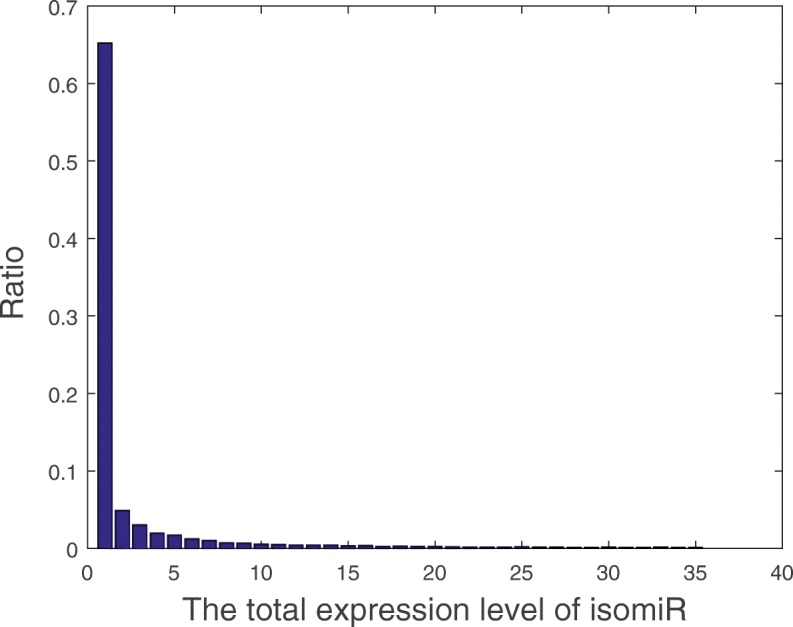
Fig. 2.

The distribution of total expression levels of isomiRs. The x-axis presents the total expression level. The ratio of the isomiRs was calculated using the number of the isomiRs in the bin divided the total number of isomiRs. For example, the ratio of the expression level isomiRs that lower than 1 is about 0.65. This implies that 65% of the isomiRs total expression level is lower than 1
