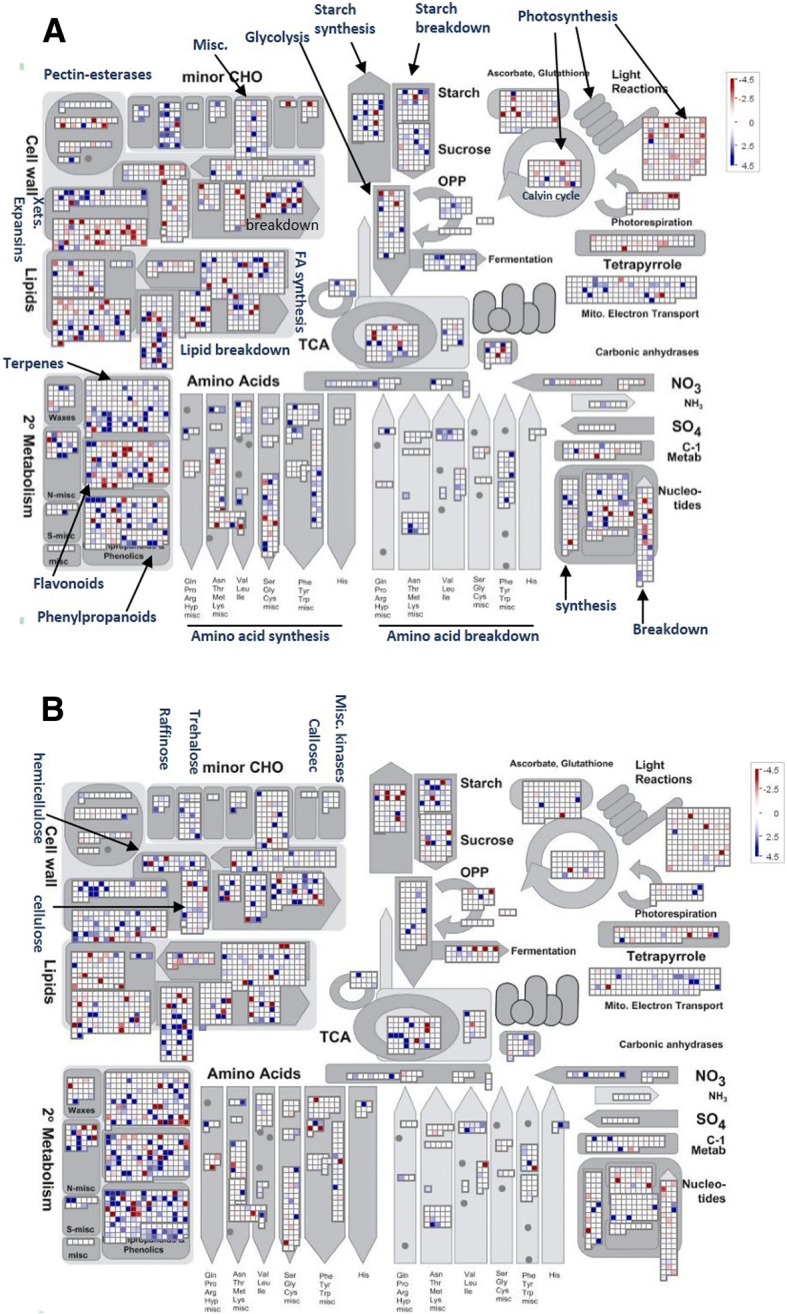
Fig. 10.

Mapman visualization of salt stress-responsive genes assigned to metabolism at the translational level. A: Salt stress-responsive genes in IR29 at the translational level. B: Salt stress-responsive genes in Pok at the translational level. In panels A and B, the grids represent individual genes. The up- and downregulated genes are indicated in blue and red, respectively. The color brightness represents the degree of difference, as shown in the scale on the right
