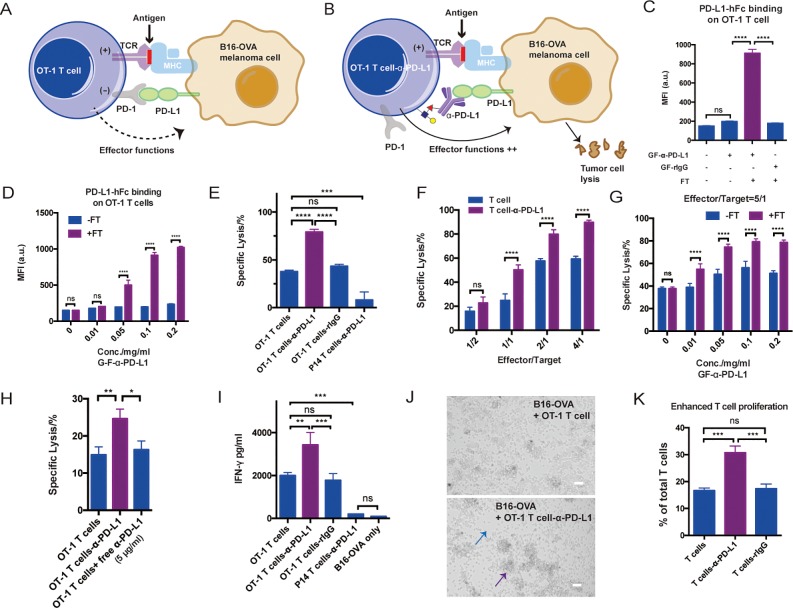
Figure 4.
Enzymatic transfer of α-PD-L1 to OT-1 T cells for enhanced T-cell activation and specific killing: (A) Schematic illustration of the interaction between OT-1 T cells and B16-OVA melanoma cells. MHC molecules on B16-OVA present OVA antigen to OVA-specific TCR on OT-1 T cells to induce activation, while PD-L1 on B16-OVA interact with PD-1 on OT-1 T cells to inhibit the T-cell effector function. (B) Schematic illustration of the blockade of PD-1–PD-L1 pathway via α-PD-L1 conjugated on the surfaces of OT-1 T cells. The in situ blockade could enhance T-cell activation and the killing of cancer cells. (C) Analysis of PD-L1 antigen binding on OT-1 T cells for different treatments. Mean ± SD (error bars). (D) Analysis of PD-L1 antigen binding of OT-1 T cells modified with various concentrations of GF-α-PD-L1. Mean ± SD (error bars). (E) Quantifying α-PD-L1-OT-1 T cell conjugates mediated killing of B16-OVA cells. Mean ± SD (error bars), representative graph from three independent experiments. OT-1 T cells conjugated with rIgG and P14 T cells conjugated with α-PD-L1 were shown as negative control. (F) Comparison of OT-1 T cells and α-PD-L1-OT-1 T cell conjugates in killing B16-OVA at different effector-to-target cell ratios. Mean ± SD (error bars). (G) Killing activities of OT-1 T cells and α-PD-L1-OT-1 T cell conjugates constructed at different GF-α-PD-L1 concentrations. Mean ± SD (error bars). (H) Comparison of α-PD-L1-OT-1 T cell conjugates with OT-1 T cells with or without additionally added free α-PD-L1 (5 μg/mL) in killing B16-OVA (3 h incubation). (I) IFN-γ secretion analysis of modified or unmodified OT-1 T cells in a B16-OVA cell co-culture assay. P14 T cells conjugated with α-PD-L1 were used as a negative control. Mean ± SD (error bars), representative graph from three independent experiments. (J) Microscopy images of OT-1 T cell-induced killing of B16-OVA with or without α-PD-L1 labeling. The blue arrow indicates fewer cancer cells, and the purple arrow indicates larger clusters of T cells. Scale bar: 50 μm. (K) Analysis of OT-1 T cell proliferation via CFSE dilution in a B16-OVA cell co-culture assay. Mean ± SD (error bars). In all figures, ns, P > 0.05; **P < 0.01; ***P < 0.001; ****P < 0.0001; one-way ANOVA followed by Tukey’s multiple comparisons test, two-way ANOVA followed by Sidak’s multiple comparisons test.

