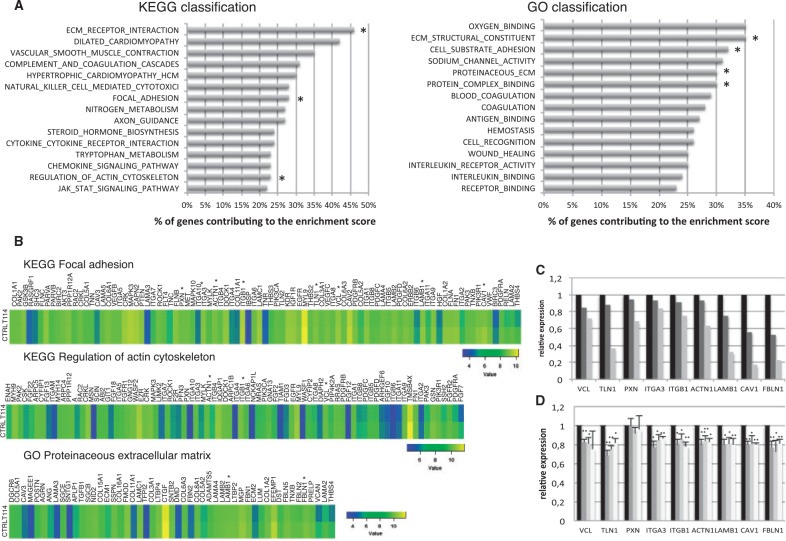
Figure 5.
Transcriptome analysis of thyroid tissue with Borealin-114 and quantitative PCR in transfected HPT. (A) Genes with decreased expression in transcriptome analysis of the thyroid tissue with Borealin-114 compared to thyroid controls. On the left, KEGG Pathway analysis of expressed mRNAs. Top fifteen enriched down-regulated pathways. On the right, GO enrichment analysis of expressed mRNAs. Top fifteen enriched down-regulated pathways. The bar plot represents the percentage of genes contributing to the enrichment score. *Pathways involved in adhesion and/or migration. (B) Examples of pathways of interest with decreased expression genes in thyroid tissue with Borealin-114 (T114) compared to thyroid tissues control (CTRL): KEGG Focal adhesion, KEGG Regulation of actin cytoskeleton, GO Proteinaceous extracellular matrix. Colour scale for each pathway is shown. From left to right, gene expression difference between control tissues and T114 is increased. *Genes involved in adhesion and/or migration and validated in HPT. (C) Gene expression of Borealin-114 tissue compared to controls in trancriptome analysis and validated by quantitative PCR (black, thyroid controls; medium gray, transcriptome results of Borealin-114 tissue; light gray, validation by quantitative PCR in Borealin-114 tissue). (D) Genes involved in adhesion and/or migration in transfected HPT analysed by quantitative PCR 48 h post-transfection (black, Borealin-wt HPT, dark gray, Borealin-114 HPT; medium gray, Borealin-148 HPT; light gray, Borealin-177 HPT). The graph represents the mean of four independent experiments. *P < 0.05, **P<0.01 calculated by t-test.

